GBPUSD Forecast and Trade Setup - 1st August, 2014
Monthly Chart
- July Monthly Candle had a negative reaction as it approached major resistance.
Daily Chart
- Very negative run, with continuous selling for over two weeks without a green candle.
- Next support which i would be interested to bottom pick is highlighted
- Previous breakout zone and a 61.8 and 88.6 fib
- should wait for a reversal candle formation on daily before considering a long trade
Outlook Trade opportunity
Wait for the market to play out now - however will be on the watch
Risk Level __
Tips -
Always take note of any economical news event on our provided calender below
NZDUSD Trade Forecast and Trade Setup for 1st August, 2014
Daily Chart
- Doji type candle formation yesterday, and the day before
- Ascending Trendline
- 78.6 and support
- Weekly S1 pivot
Hourly Chart
Positive Stochastics Divergence on H4
Outlook Trade opportunity
Buy Stop above my yellow support zone would be ideal, and stops below this weeks low.
Or you could wait until it performs a higher high on an h4 / h1 chart
looking for near 0.86
Risk Level Medium- High
Tips -
Always take note of any economical news event on our provided calender below
AUDUSD Forecast and Trade Setup for 1st August, 2014
Daily Chart
- Bullish Cypher
- Approaching 78.6 fib and support (on a H4 TF)
- note support is not huge, on the daily tf, however
- Possible bounce here as it could be a retest of the broken descending trendline
- On the H1 TF - there is positive divergence on Stochastics, MACD, and RSI
Outlook Trade opportunity
Drill down to a H4 Timeframe for a bullish candle pattern for a long trade as the selling momentum is quite strong, and with the NFP tonight, a on par or slightly positive data would make the aussie fall even further to the daily chart support
Risk Level HIGH
Tips -
Always take note of any economical news event on our provided calender below
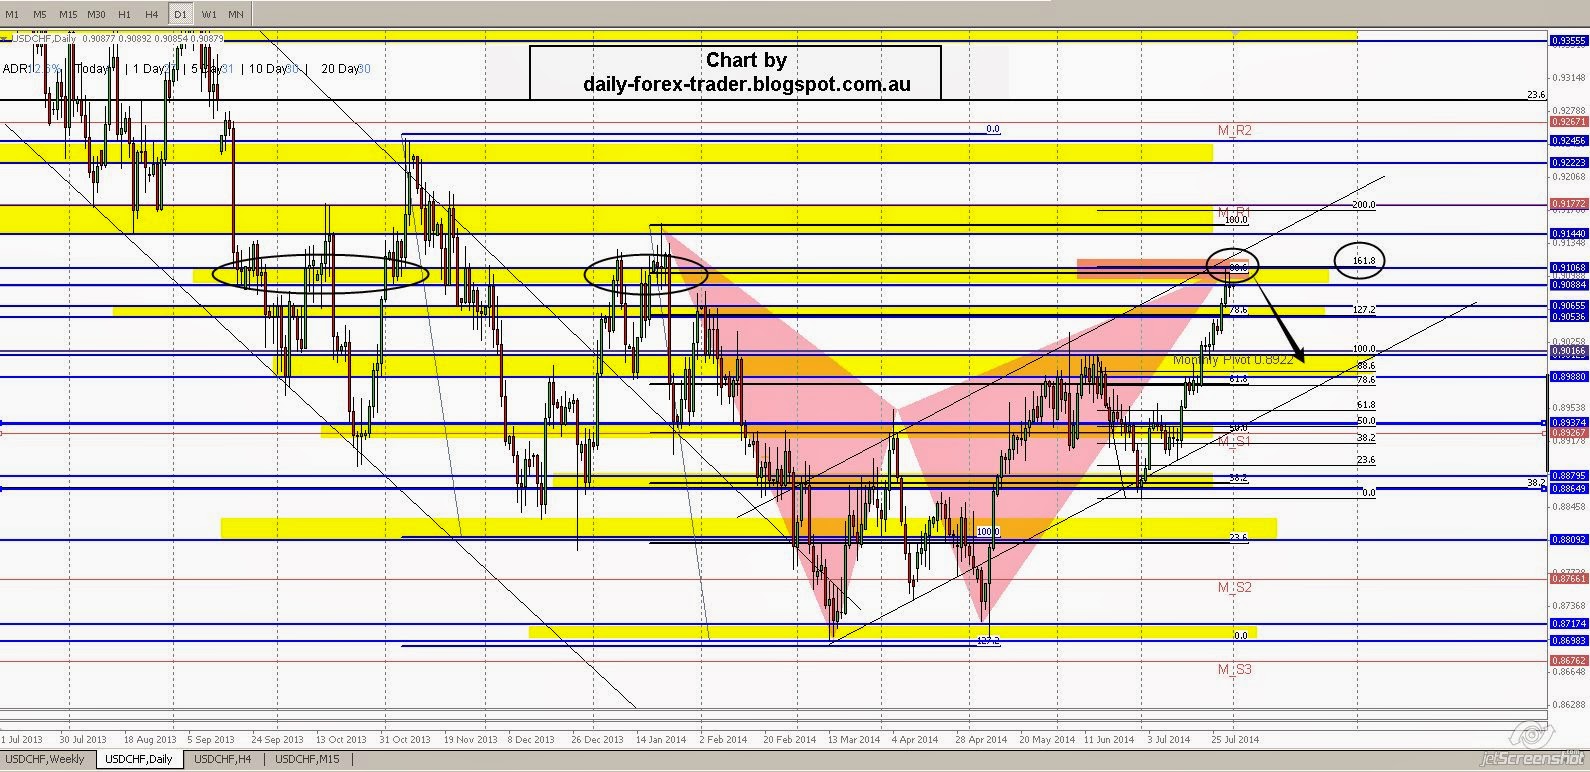
USDCHF Forecast and Trade Setup for 1 Aug, 2014
Daily Chart
- Doji Candle from the 88.6 / resistance zone (note its also a 38.2 on a weekly chart)
- Also the upper band of the bullish channel
Weekly Chart
Outlook Trade opportunity
Being a friday and NFP in 12 hrs time, I would have wide stops and a smaller position if i had to trade this (counter trend) and target the bottom of the upward channel
Risk Level Medium
Tips -
Always take note of any economical news event on our provided calender below