EURNZD Position Trade for 2014-2015
Weekly Chart
- After 4 consecutive years of the down trend, last year in 2013 we saw a bullish momentum take place
- Broke out from a bearish wedge formation in 2013
- In 2014, prices has retraced back towards a possible forming upward trendline / near lows of 2012 and 2013
- A bullish bat pattern also signals possible reversal pattern
Daily Chart
- Ascending MACD Oscillator broke through above the 0 line after reacting from the PRZ of the weekly bat pattern
Outlook Trade opportunity
Long at around the most recent upward swing fib 38.2 - 50 level, with stops either at the 2013 low OR the low of 2014
At least aim for a 2:1 Reward to risk
Risk Level - LOW
Tips -
Always take note of any economical news event on our provided calender below
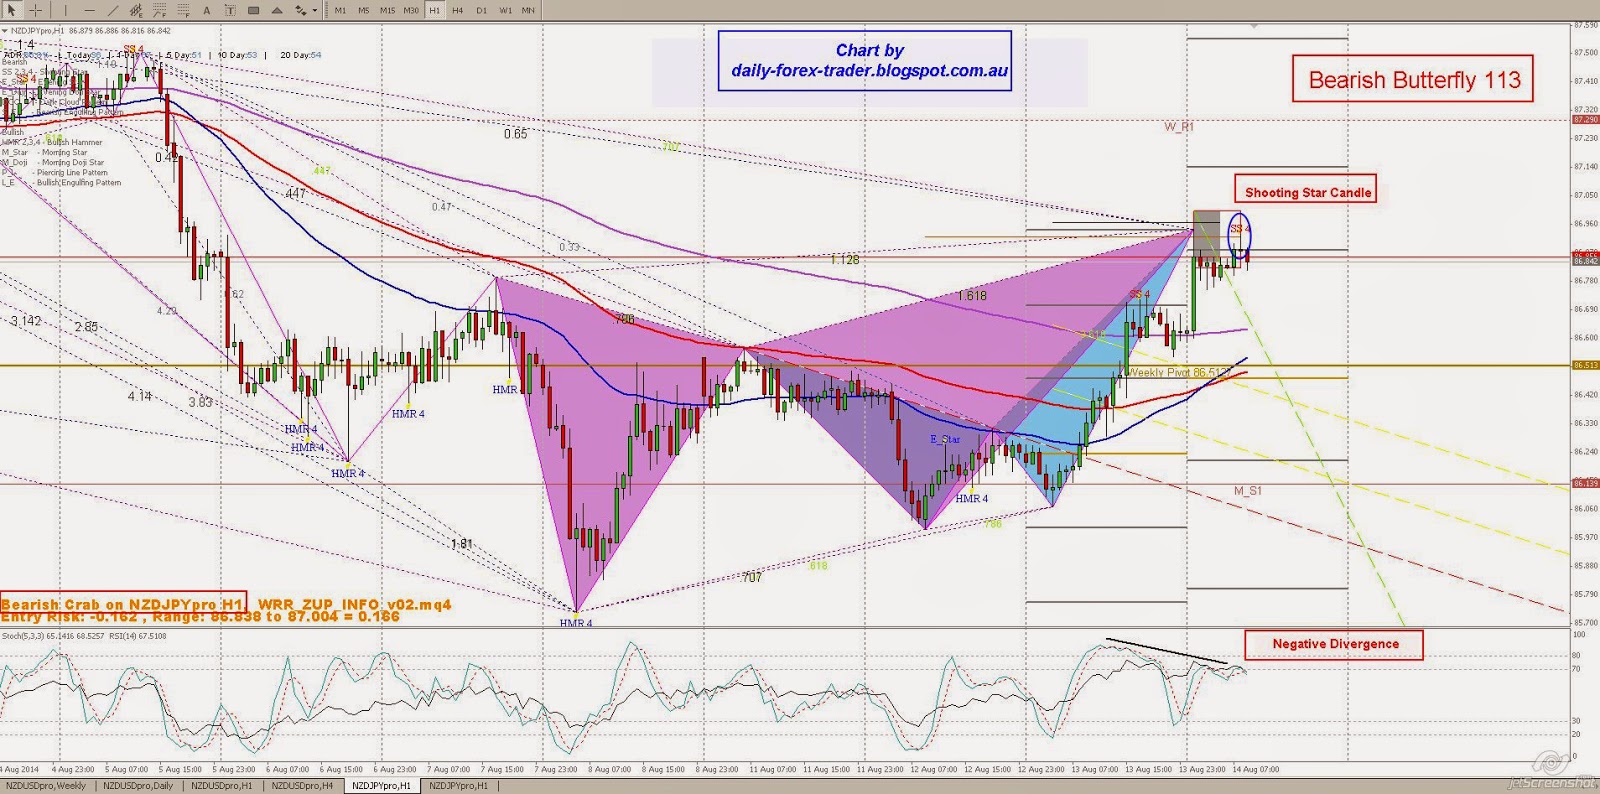
NZDJPY Trade Setup for 14th August, 2014
1 Hr Chart
- If prices do get to the R2 Daily Pivot , it has very good confluence levels there
- 127.2 Inverted Fib
- 200 inverted fib
- 78.6 Fib Retrace level
- and Daily Range high (using average pip movement per day)
- We also have two harmonic patterns identified from my EA which usually is a good indication as well,
- If you switch to a 4hr chart, the downward slopping 100SMA is at this level,
- We also have a small 1hr shooting star during asian session
Outlook Trade opportunity
Perhaps short trade opportunity now or later depending how you see the market
Risk Level Low
Tips -
Always take note of any economical news event on our provided calender below