AUDUSD Forecast and Trade Setup for 28th of Feb, 2014
Sentiment - Bullish
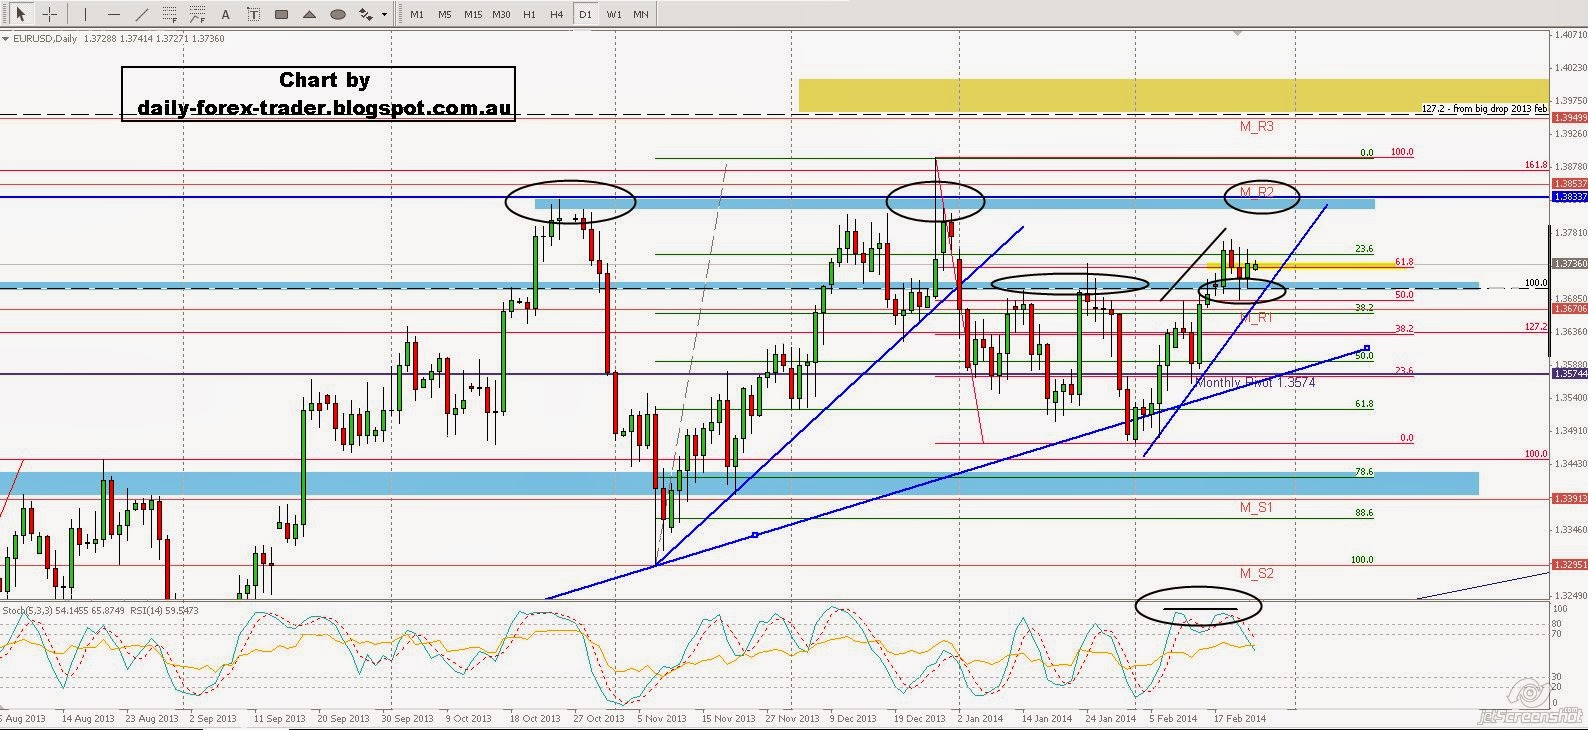
Daily Chart

- Pin bar at support performed
- Which is also the 38.2 from the lows to the recent highs)
- Trading in the Ichimuko Clouds
- Inverse heads and shoulders
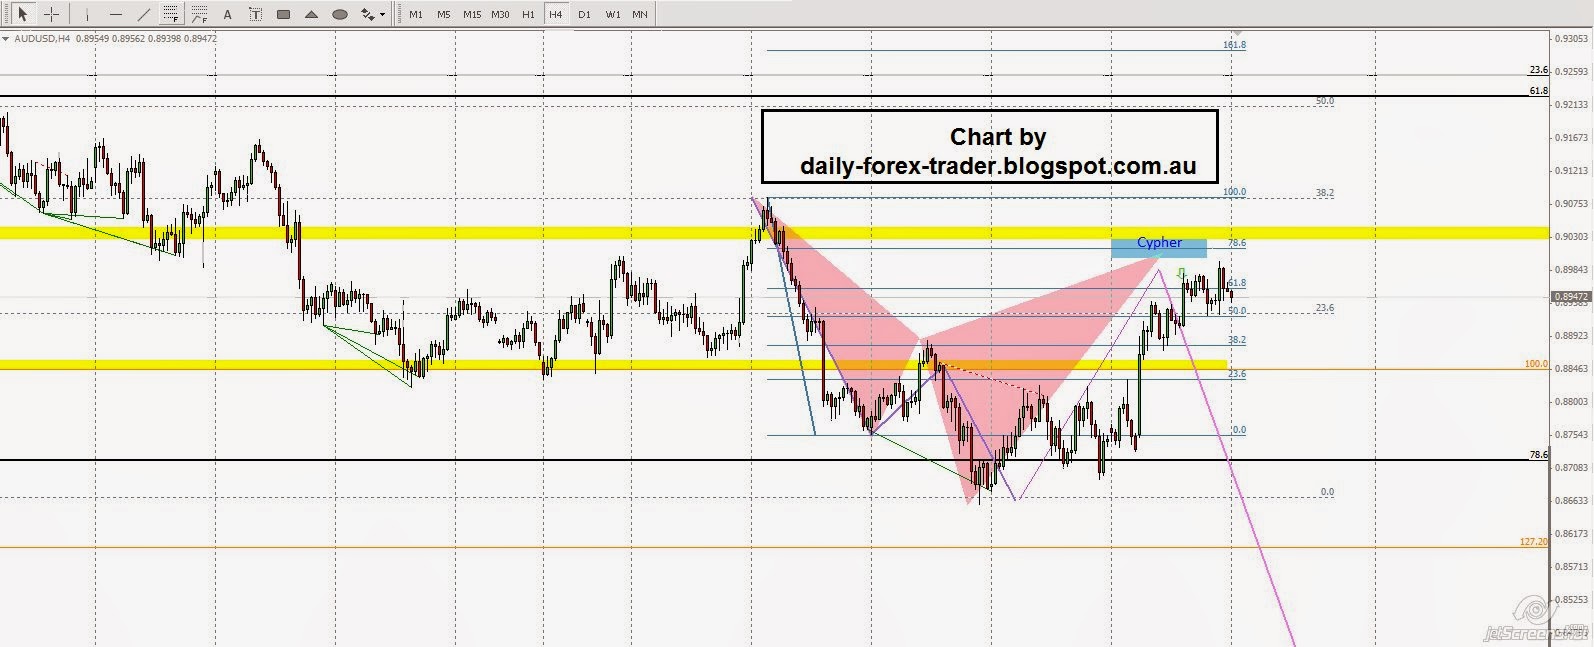
Hourly Chart

- Inverse Head and Shoulders
- Rejected from Weekly S2 pivot and also trend line drawn
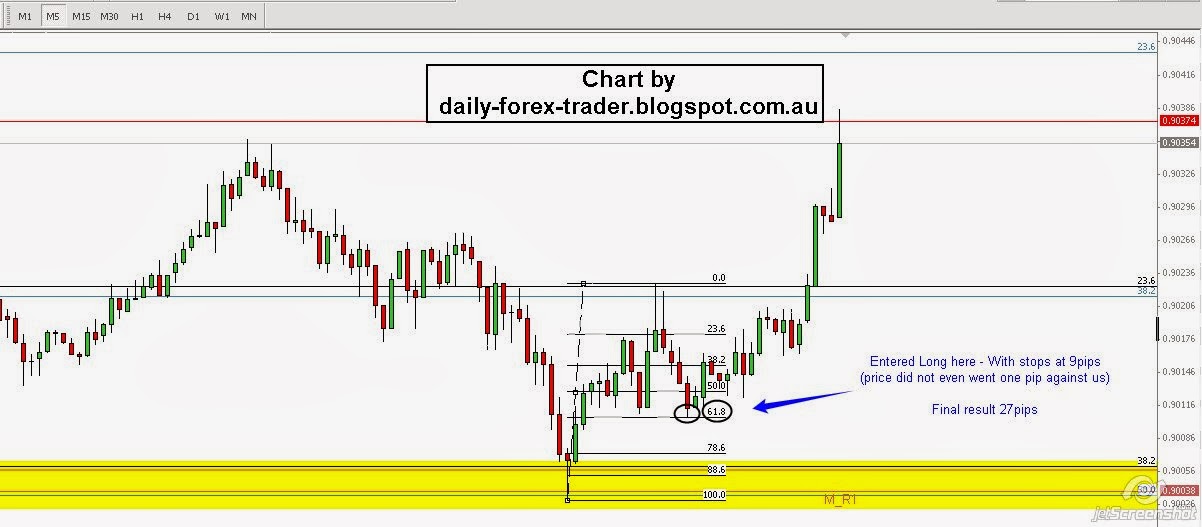
Outlook Trade opportunity
My view on the Aussie is bullish (which was the same view since last week)Yesterday Daily candle closed with a very good pin bar from a support area, and we should take opportunity to get on to the bullish run to recent highs to test resistance and possibly break higher.