AUDUSD Forecast for the week 20th January, 2014
Daily Chart
- We have broken a main support last week after rejecting the monthly pivot level
- A retest of which now as resistance would be a good entry for trend continuation down
- Forecast support is at the 127.2fib ext which also is the Monthly S2 pivot at 0.862
4H Chart
- We are hoping the market would retrace to around the 50% (127.2ex) or 61.8 (161.8ex) so we could go short
Outlook Trade opportunity
Trade opportunity to go short and follow the trend is shown on the H1 Chart
Risk Level LOW
Tips -
Always take note of any economical news event on our provided calender below
USDJPY forecast for the week 20th January, 2014
Daily Chart
- Based on the daily chart, Price action clearly rejected from support with a bullish englufing candle
- Potential for new highs
4h Hourly Chart
- There is a slight divergence on the stochastic
- Asian Session started lower, and found support at the 50% retrace
- Trend followers should consider going long from here
Hourly Chart
- The 50% retrace level, is also a confluence of fib ext 127.2 from recent swing down (retrace leg), if this level fails, the 61.8% is next support (and 161.8 ext)
- Next potential strong resistance is at the 106.-106.200 where we find many confluence of fib ext levels - Counter trend setup
Outlook Trade opportunity
Opportunity to go long following confirmation in Daily chart. (Please see H4)
Another opportunity is a counter trend trade which probably won't be this week, however would setup a sell order at the projected major resistance level (please see H1 Chart)
Tips -
Always take note of any economical news event on our provided calender below
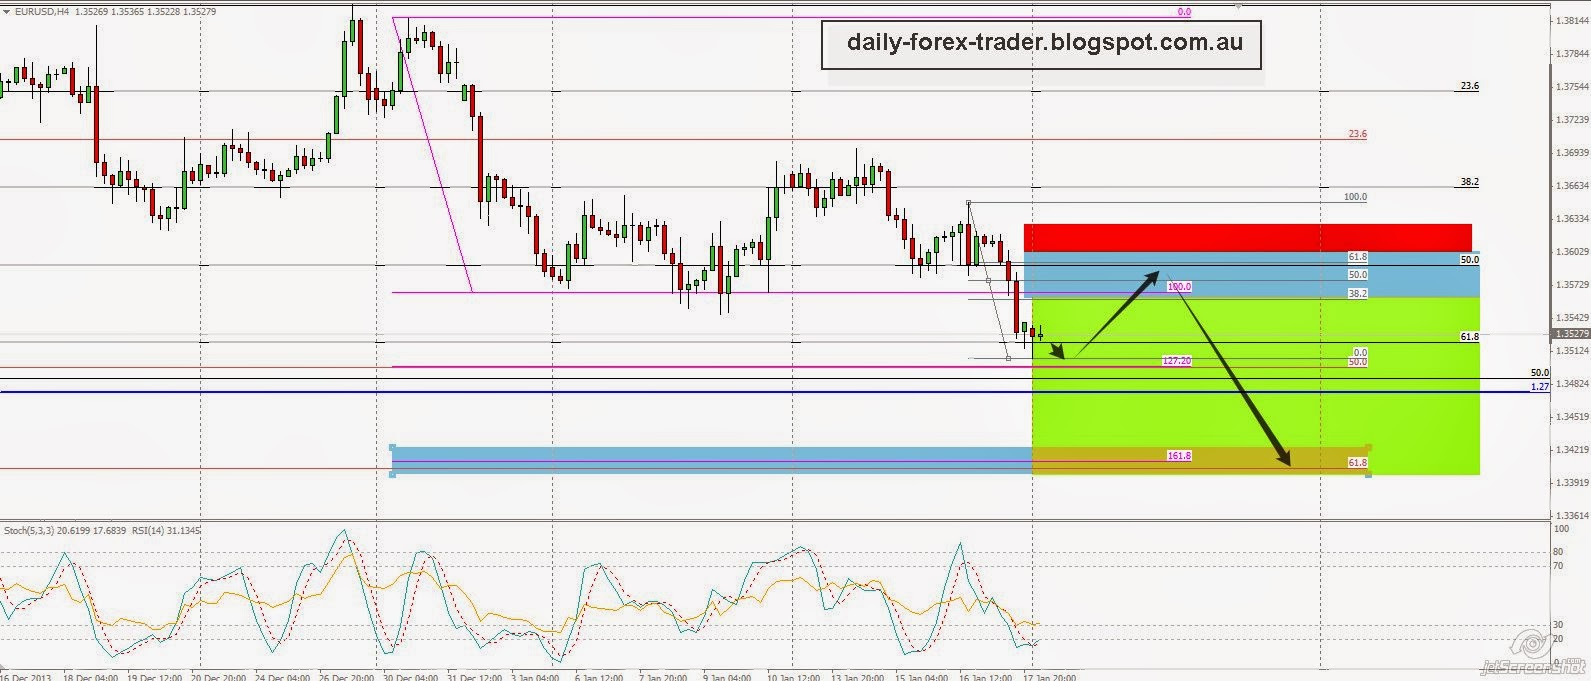
EURUSD Forecast for the week 20th January, 2014
Daily Chart
- After beginning the week a tad higher , we hit resistance around the 61.8% retrace and continued lower
- We have found temporary support at a 61.8% retrace from NOV low to Dec Highs,
- Price action shows very heavy pressure and looks like a potential to go lower
- Stronger support is lower at around 1.345 which is a confluence of a fib extension of 127.20 (reverse calculation of most recent swing retrace) & a 161.8 fib ext (of the Dec highs swing down to first week of Jan) and Also which is a Mid Monthly pivot from S1 to S2.
- At this stage, trend traders would look for opportunity to short if Monday / Tuesday provides some retrace and Target 1.345 (As shown in 4 hourly Chart)
4 Hourly Chart
- A very good potential short setup if a retrace to the 38.2/50/61.8 fib level with confirming price action candles to follow the short to find lower lows
Hourly Chart
- Monday Asian session hourly candle had shown price action tried to break lower, but with another candle recovering (engulfing or a railway candlestick pattern) - this is showing market finding support at this current stage and wants to retrace higher before continuing down
- On my hourly chart, I have only shown possible counter trade levels
Outlook Trade opportunity
This week I have a few trade setups.
Trend following Trades -
1 - Please look at the 4h Chart and Daily Chart
Counter Trend Trades
2 x Trade levels on the 1H Chart
Tips -
Always take note of any economical news event on our provided calender below