Free Analysis and Trade Recommendations - Follow us on Facebook and Twitter @Forex_Trader168
Tuesday, July 1, 2014
NIKKEI Forecast and Trade Setup for the week ending 4th July 2014
USDJPY Forecast and Trade setup for the week ending 4th July, 2014
USDJPY Forecast and Trade setup for the week ending 4th July, 2014
- Take note of the H1 Trend Filter chart
Daily Chart
- Yesterday closed at the support, and will be looking to see if there is any bullish price action reaction from it (on the 1 Hourly we have bullish signals)
- Note the USDJPY is one of the weaker ones today compared to other yen crosses. This is due to the fact that the us dollar index has fallen through major support today.
Hourly Chart
- Interesting scenario here where Daily and H4 is all pointing bearish indicators, however H1 just past few hours managed to be in a bullish territory according to the table below
- possible bullish setup at a support zone
|
Trend Filter
|
Daily
|
H4
|
H1
|
|
3 MA Cross
|
Bearish
|
Bearish
|
30/50 crossed to bullish
|
|
30SMA
|
Below
|
Below
|
Above
|
|
50SMA
|
Below
|
Below
|
Above
|
|
100SMA
|
Below
|
Below
|
Above
|
|
Ichimoku
|
Bearish
|
Bearish
|
Broke above the bearish clouds
(Bullish signal)
|
|
SCORE
|
5/5
Bearish
|
5/5
Bearish
|
ALL Bullish SIgnals
|
Outlook Trade opportunity
On a H1 we could look for retrace and possible take a long trade to test 101.6-101.7 , however it is good to take note that us dollar index is very weakRisk Level - Low Medium
Tips -
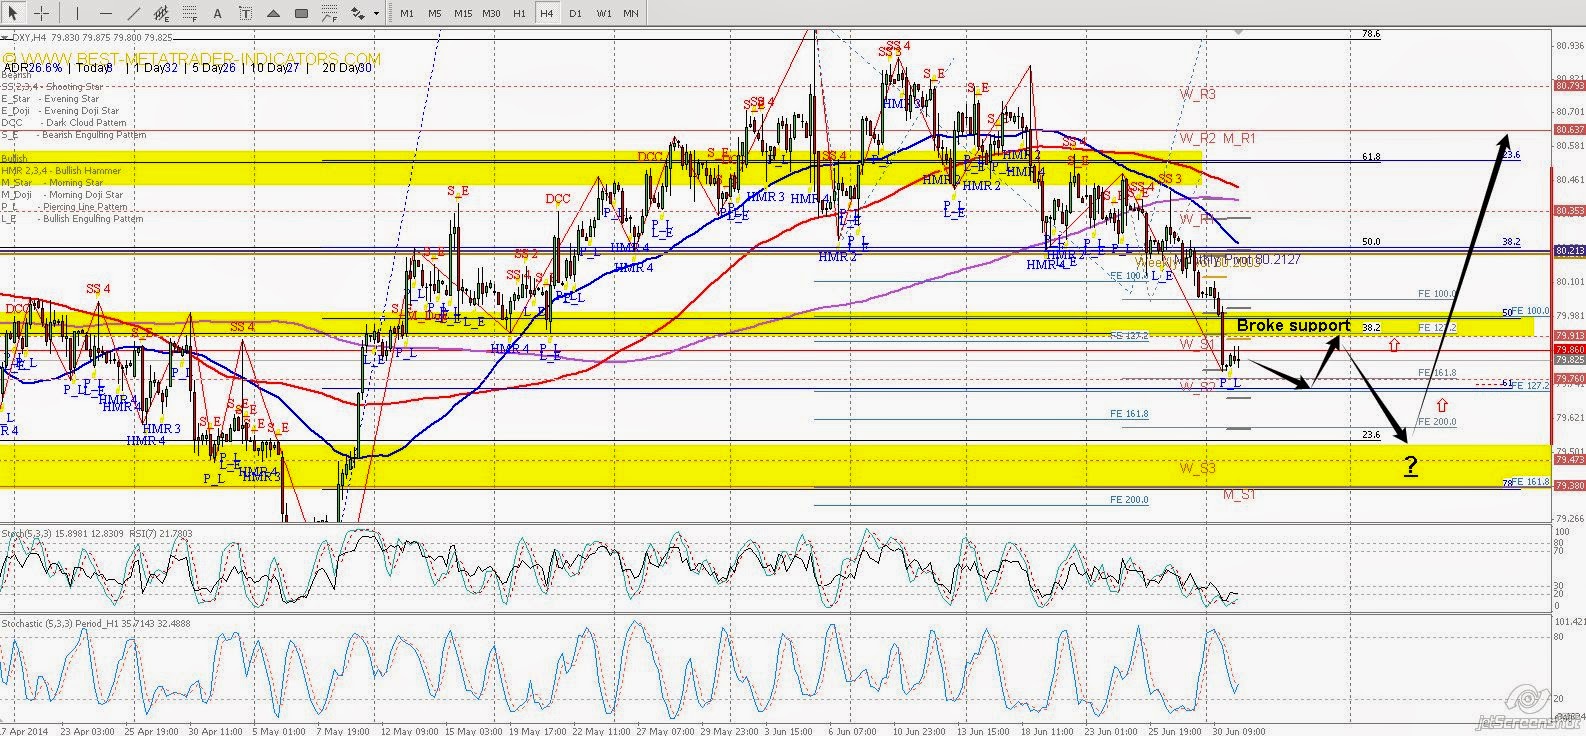
Always take note of any economical news event on our provided calender belowDXY US DOLLAR INDEX - Broke support, Next support to keep an eye on
DXY US DOLLAR INDEX - Broke support, Next support to keep an eye on
Daily Chart
- Very bearish condition as we have a very negative day yesterday breaking the 80 level / support
- Support is found possibly at a 61.8 retracement level, however strong support is at the 78.6 retracement
Hourly Chart
- Possible bounce could be found at a 61.8 retracement, however could be short lived as it could continue another leg down
- Note - we have NFP one day earlier this week which could possible bring a reversal
Tips -
Always take note of any economical news event on our provided calender below
Subscribe to:
Comments (Atom)


