Monday, December 30, 2013

AUDUSD Daily , Weekly Outlook for 30th December, 2013 (MONDAY)

AUDUSD Daily , Weekly Outlook for 30th December, 2013 (MONDAY)


Weekly Chart

  • Trend is Bearish
  • Stochastics is oversold but flat
  • RSI pointing slightly down and above 30
  • At a important level of support
Looking at the weekly, it seems oversold, however further downside is more appealing.  


Daily Chart


  • Trend is down
  • Stochastic is pointing down
  • RSI is around 30
Base on the Daily chart, I cannot trade it at these levels, Indicators are pointing lower , as the upside is limited as we previously tested last week. We will wait for the market to tell us what to do.


Hourly Chart


  • Trend is Down
  • Stochastic pointing up
  • BAT pattern , however upside limited
By the time i wrote this, I am too late to join the bat pattern play. On the upside resistance come at the 0.88720 and 0.8890, If market reaches there, we could have a short position.

Outlook Trade opportunity

Risky trade to hold longer times , so better trade scalps
#1 - Short from 0.8872
#2 - Short from 0.8890

Risk Level High


Tips -

Always take note of any economical news event on our provided calender below


USDJPY Daily and Weekly Outlook for 30th December, 2013 (MONDAY)

USDJPY Daily and Weekly Outlook for 30th December, 2013 (MONDAY)


Weekly Chart


  • Trend is Bullish
  • Weekly candle is bullish
  • Stochastics is overbought but still going north (slightly)
  • RSI is near overbought
  • Clear break upwards from previous yearly high,
  • Long term descending trend line is near together with 61.8 retracement level
My view long term is bullish and will break out of the descending trend line. It appear to me that we are starting the C to D leg.

Daily Chart


  • Trend - Uptrend
  • Stochastic although overbought, still going north
  • RSI reading is above 70
  • Currently trading just below the 161.8 fib ext from the candle which broke the resistance - this might hold as short term resistance,
On the Daily Chart, it tells me it still wants to go north , and for real shorting opportunity I would be looking at the 200fib ext.  Currently trading just below the 161.8 fib ext from the candle which broke the resistance - this might hold as short term resistance, and maybe could have scalping opportunity for shorts in the hourly of lower. 

My view is that market should go up to the 106's , how it gets there is either we shoot up there, or retrace and test the breakout level at around 104.30 before going up


Hourly Chart


  • Trend - Bullish
  • Stochastic is pointing down from overbought zone
  • RSI also pointing down from overbought zone
  • We might want to retest breakout area from Friday which is also the Daily Pivot line 105.0
On the hourly shows good breakout from Friday, We might have a breather and retrace to retest the 105 before going north again.

Outlook Trade opportunity

#1 - Long at Daily pivot 105.00 with confirming price action.

#2 - For aggressive traders - currently opportunity to short and target Daily Pivot area (because of the indicators pointing south and price action early asian session)


Risk Level Medium


Tips -

Always take note of any economical news event on our provided calender below


EURUSD Daily And Weekly Outlook for 30th December 2013 (Monday)

EURUSD Daily And Weekly Outlook for 30th December 2013 (Monday)


Weekly Chart


  • Trend - Bullish
  • Ascending Trend line since July 2013
  • Third weekly candles showing holding above 1.365-1.37 
  • Stochastics - Crossed / Down
  • Weekly Candle - Shooting star / Bearish
  •  Close to Weekly Descending Trend line which spans from 2008 , 2011 second touch, 2013/14 potential third touch
  • Clear rejection from 61.8% back from downtrend from 2011
  • Confluence of levels of 161.8 fib extension of first leg from July 2012 low to first week of Sept 2012
3 Bullish points, and 5 Bearish Points


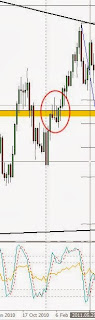
Jan 2011 (same levels)
There are more bearish signals from my bullet point summary above, then there is bullish. However zooming into major support, we are still trading on major support level of 1.365-1.37 which we are holding for the third week.


If you look at the candles in January 2011, trading around the same levels which we are currently in, there were shooting stars showing bearish (3 x consecutive week), and finally the fourth and fifth week the bulls win the race and headed higher for many weeks after.

Currently pure price action this tells me it wants to go higher, 

  1. In October it broke this major level
  2. Following two weeks broke back below it,
  3. Then following 7 week we regained the drop and now trading back above the major level
  4. whats next? -  If it goes higher, I will target the 127.20fib ext (1.3970) which will have a potential butterfly pattern to the downside


Currently pure price action - this tells me it wants to go higher, but will it? .... lets see a lower time frame
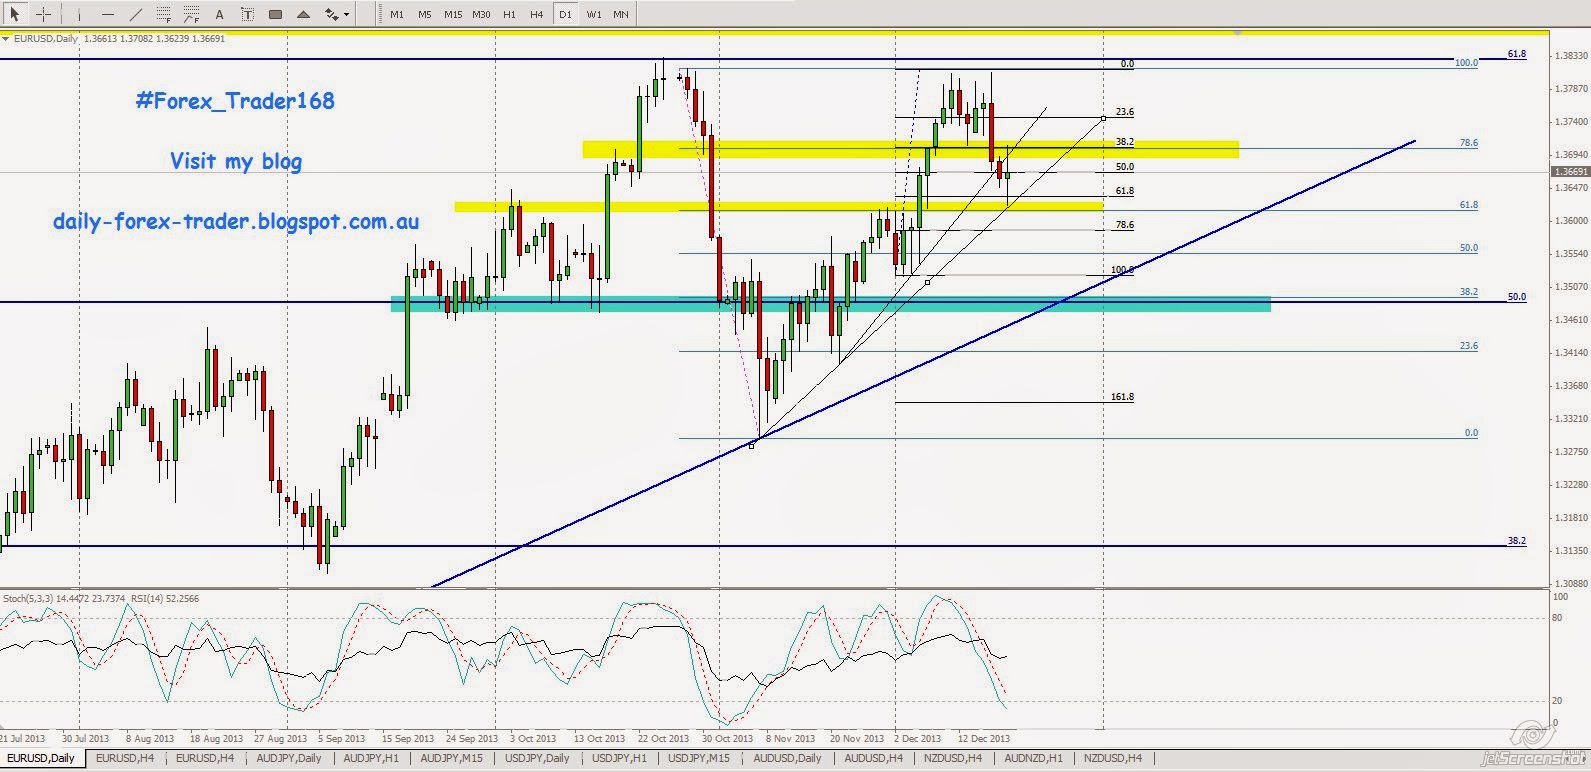


Daily Chart


  • Trend Ascending / Bullish
  • Ascending Trend Line respected third touch
  • Stochastic are pointing upwards 
  • RSI reading is 60
  • Trading above major support
  • Friday candle is bearish (shooting star), however is in a messy area and not a clean area. - eg if you look left, what do you see? lots of action!
5 Bullish points, and 1 Bearish point


If I were to look at just Friday's candle alone, I would go short, however on a bigger picture where that candle is, its not appealing, and even if the short side of things, you have the ascending trend line + major resistance not far from.  

From my analysis on this daily chart, there are too many bullish points, at this stage any trade, I will look for a long opportunity.

Hourly Chart


  • Huge spike which hit the R2 Weekly Pivot and also the 127.20 extention
  • Stochastic are extremely oversold, and has crossed lines but not clear
  • RSI reading is around 50
  • The retrace is currently paused at around the 61.8 fib back (if drawn from the low of 20th of Dec


If we draw the fib from the 24th Dec low, we have broke the 61.8 back, and potentially looking for the 78.6 back which is last weeks pivot weekly / 1.37060 level , This will be a retest of the breakout level, which could potentially find new highs.  Any break below this area will have to reanalyze further trades direction

Still looks bullish to me


Outlook Trade opportunity

Please look at my hourly chart, I have two yellow levels, 

  • one at a 61.8 fib / 1.37270
  • second at the 78.6fib / previous wks pivot / 1.370 levels

If my forecast (bullish) is right, the question is will it retrace to my second entry, because after such strong move up? , safest way for entry is to wait for price action confirmation for entry

Risk Level - LOW


Tips -

Always take note of any economical news event on our provided calender below


**Update** -
Entered long from my first level and waited for confirmation


Friday, December 27, 2013

EURUSD Update - Aggressive Asian session - gartley

EURUSD Update - Aggressive Asian session


This is in play

88.6 from a swing from 3rd dec

78.6 from most recent high 11th dec / 18th dec


Perfect 61.8 AB


Lets see how this plays out

I am still short and added onto my previous position


Cheers

EURUSD Filled my order at sell zone (as per Monday's 23rd December Trade Setup )


Hope everyone had a nice break from the Christmas period! 

For those back trading again, want to let you know the the EURUSD had reached my sell zone around an hour ago and filled my order for a short. This was an analysis and recommended trade setup from Monday the 23rd December. (pls refer to previous post or the blog post )
Please trade carefully and take partial profits as we hit fib levels


Cheers

USDJPY Post xmas trade

Hello Everyone!
Just want to share this trade setup I did prior to the holidays which got filled this morning.


(Unfortunately this trade setup was not in my blog of analysis and trade recommendations as I was too excited for the holidays and didn't end up writing it)

This trade is a counter trend trade with no replacements in my study. So therefore was using fib extention forecast to pin point possible retracements
  1. This level is a 161.8 fib ext 
  2. weekly resistance pivot level, 
  3. Physiological level 
With three points - some sort of retracements is highly likely.

Currently took partial profits (majority of my trade out at 15pips) and will look for lower and b.e stops


Tuesday, December 24, 2013

USDJPY - AB = CD ?

USDJPY - AB = CD ?


Possible ? lets see!


**updated at 12:30GMT** - nope, no AB=CD :-)


Earlier today i took short trade - took partial profit at around B
*this is still in play as of 12:30gmt)

Three winning trades these two days prior to xmas! - Total - 53 pips and still going

Profits this week so far for AUDJPY, EURUSD, USDJPY

(i haven't updated my profits from last week. sorry being slack here, it takes time counting! - will update later) 
For this week so far, three trades came into play as per my trade setup - Two of them closed already while one is still active with partial profits taken

AUDJPY - 15pips
EURUSD - 30pips
USDJPY - 13pips partial TP (still going)

Cheers! and Merry Xmas to you all!


Monday, December 23, 2013

AUDJPY Daily Outlook for 23rd December, 2013 (Monday)

AUDJPY Daily Outlook for 23rd December, 2013 (Monday)


Daily Chart

  • We are in a descending channel , and have bounced very well from the bottom of the channel
  • Short term view is that we will test the upper channel / 78.6 retrace of recent swing from top channel down.


Hourly Chart

  • On the hourly chart, we are getting close to Sell zone or 61.8% retrace - this is an opportunity for a short trade
  • There is also a higher sell zone at around the 78.6% retrace, which is also the R1 Weekly


Outlook Trade opportunity

There are two areas possible for shorting , for conservative traders please trade the higher one.
#1 - Short at 61.8% retrace approx 93.00 - TP 20pips
#2 - Short at 78.6 / R1 weekly - 93.50 - TP 40pips minimum

Risk Level High


Tips -

Always take note of any economical news event on our provided calender below


USDJPY Daily Outlook for 23rd December 2013 (Monday)

USDJPY Daily Outlook for 23rd December 2013 (Monday)

**this is my personal favorite setup for the week**


Daily Chart


  • We are trading within the 104's area which is not a strong support
  • We expect the market to test the resistance in the near term.


Hourly Chart


  • Fell of a rising wedge and was according to my analysis last Friday
  • I hope for market to go down to the blue area which is my demand level  (50% fib retrace)which looks attractive as we haven't retested this area as an support after breakout to the 104's 


Outlook Trade opportunity

Two trading opportunity here, my forecast is for price to go down to test the 50% retrace at 103.550 near term. So i will have a buy limit at that area.

If market retraces back up to around 104.32 before hitting my forecast area, i will be shorting from there down to potentially my target area and taking partial profits on the way

#1 - Short at 104.32 (only if prices have not reached my forecast of 103.550) - Target to 103.550 while taking partial profits on the way and Break even for a risk free trade)

#2 - Long at 103.550 for initial 20pips profit take majority of position off, and leave small portion for bigger trend continuation to the upside.


Risk Level Low


Tips -

Always take note of any economical news event on our provided calender below


EURUSD Daily Outlook for 23rd December, 2013 (Monday)

EURUSD Daily Outlook for 23rd December, 2013 (Monday)


Daily Chart

Friday's candle shows indecision and bouncing of my previously drawn support and resistance area. 
If I draw a trendline from the lows of the Stochastics Indicator from nov to now, it has broken the trendline and I would be looking out for possible continuation higher after the current retrace.

Hourly Chart


Not much to say as Fridays bounce from a resistance / demand zone which I had previously predicted. On the indicators we are diverging right now. I expect the short term that are bearish until the 1.5950 (my green support area on chart if we can get there)

Outlook Trade opportunity
Our forecast for trades last Thursday and Friday was to the pip, I hope I can continue this trend :) As you can see I have drawn in two sell zones. The first one is possible in the asian session, and the second one might be possible after the Asian session.

I will also have a small buy limit order at the green zone i drawn

Risk Level Low


Tips -

Always take note of any economical news event on our provided calender below


AUDUSD Daily Outlook for 23th December, 2013 (Monday)

AUDUSD Daily Outlook for 23th December, 2013 (Monday)


Daily Chart


On Friday, After over 7 days of bearish days we finally have a good bullish candle reaction from a major support zone. Even though price bounced from the support zone formed in august,  it concerns me that price did actually fall below August lows creating a new low for the year. This to me shows strong selling pressure.  Next time when price comes to this area, i would expect this area not to hold and price to go lower

  • Formed fresh new yearly lows on Thursday, and rebound on Friday
  • Formed new yearly low 
  • Slightly broke support from august which to me shows strong selling pressure
  • Next time when price comes to this area, i would expect this area not to hold and price to go lower
  • Stochastics is turning up
  • My sell zone / resistance area is at the 0.90 - 0.9050


Hourly Chart

1 Hr Chart
4 Hr chart

On Friday we had a good positive ending day which brings us back up trading in the 0.89's.  I am expecting bullish momentum to be short lived towards the .90's and resuming the bearish momentum.
Indicators wise, on the hourly chart stochastics are turning, and on the 4hr slight divergence is possible.


  • If we look at the 4 Hr chart, you can see we are in a descending Chanel 
  • At this stage i would go long on dips at around the pivot daily area (.890) 
  • Resistance area is at the .90 where we will go short


Outlook Trade opportunity

For Today i would buy dips at around the daily pivot area, (0.890) Looking for a 1:1 reward.
Its holiday season so not much action is expected.
We will also setup a short limit order at the 0.89594- 0.90 area

Risk Level - Medium


Tips -

Always take note of any economical news event on our provided calender below


Saturday, December 21, 2013

EURUSD - Oh i bagged another 30 pips in a few minutes right after i got my 60 pips

EURUSD - gave me 90pips today

(60pips from fridays analysis, and 30pips from thursdays)

Did you follow my Thursday's sell limit order setup?

If you did you could of got 30pips just like that


EURUSD - 60 pips profit on a Friday

60 Pips profit for today on this trade

Anyone followed my trade setup early today for a EURUSD Long?
If so you were able to bag 60pips!

Hows that for a free trade recommendation?

Please like our facebook and twitter page for support!

I do these each day for free, and hope you guys can like my facebook and follow my twitter!

Twitter #forex_trader168
Facebook -Click here!


Friday, December 20, 2013

AUDJPY - Bearish Butterfly spotted which confluence my short analysis at the same spot

Found another bearish butterfly on Aussie Yen


This morning my analysis (not looking at harmonic patterns) was to sell at 50% retrace area / pivot weekly / 127.20. Little that i know that there was a potential bearish butterfly. This correlates very well with my analysis for this setup.
Hope this goes in our favour

Happy trading!

Howard
#Forex_Trader168

USDJPY - Bearish Butterfly Harmonic Pattern

Hey Guys
Spotted this one on the US Yen pair.
This morning my analysis was to sell at the 141.4 Fib extention - it got filled
then i realized this was in play (Bearish Butterfly)


Happy trading guys

Cheers

Howard
(#Forex_Trader168)


*Updated 3:21PM GMT
Took profits at around 29 pips / 25pips / 10 pips (3 levels)


AUDUSD Daily Outlook for 20th December 2013 (Friday)

AUDUSD Daily Outlook for 20th December 2013 (Friday)


Daily Chart

  • On the daily chart it broke through the August 30th Lows / broke through 100% full retrace
  • Because of this we expect the market to go lower after retrace and towards 0.870


Hourly Chart


  • Market was trading within range yesterday, however at the time of writing it has broke up from the range yesterday,
  • We are aiming for the market to go up to Daily Pivot R2 and go short from there
  • At that level there is a 61.8 retrace, and FE100 which gives room to short to go back to FE127 at least


Outlook Trade opportunity

Our Short limit placed at 0.89050 - for around 30pips partial tp, and let market play down to new lows. Lets hope we get filled

Risk Level Low


Tips -

Always take note of any economical news event on our provided calender below


USDJPY Daily Outlook for 20th December, 2013 (Friday)

USDJPY Daily Outlook for 20th December, 2013 (Friday)


Daily Chart

  • Held quite well at the new support area 
  • We are looking for 105 before some bigger entrancement 
  • Please note the bearish butterfly is still a potential setup to the downside


Hourly Chart


  • On the hourly the new support is very well respected
  • We will look for opportunity to short at the 104.50 (141.4 fe) for a small trade
  • Stochastics are overbought, but if goes higher, to 104.50 possible divergence 


Outlook Trade opportunity

We will look for opportunity to short at the 104.50 (141.4 fe) for a small trade for at least 15pips profit where we will tp 80% of the trade and leave2 0% to run lower 

Risk Level Medium


Tips -

Always take note of any economical news event on our provided calender below


AUDJPY Daily Outlook for 20th December, 2013 (Friday)

AUDJPY Daily Outlook for 20th December, 2013 (Friday)


Daily Chart

Respected the descending trend line and support quite well

  • Good rebound from the descending bottom trend line channel and support
  • We expect the market to pause at the 50% fib level for a small shorting possibility

Hourly Chart

  • A strong upward move from Tuesday , we expect the market to go closer to the weekly pivot / 50% retrace fib area and should take a breather there.
  • The Stochastics are very close to overbought area (+80)


Outlook Trade opportunity

Our sell limits are placed at the 50% retrace area / pivot weekly / 127.20 -141.40 fib extension. We will take profit with a 1risk:2reward and will take partial profit when it hits 1:1.


Risk Level High - due to the strong uptrend


Tips -

Always take note of any economical news event on our provided calender below


EURUSD Daily Outlook for 20th December, 2013 (Friday)

EURUSD Daily Outlook for 20th December, 2013 (Friday)


Daily Chart

  • Euro Continued to go lower, and now getting close to major support area of 1.3620
  • We expect the market to stall and minor retrace at this area


Hourly Chart


  • good buying opportunity right now while i post this blog!
  • Prices are at major support area (61.8% retrace from swing from december)
  • another 61.8 level from oct high to nov low
  • good s&r area from day chart, 4hr, 1hr charts
  • We expect the market to stall at this area and retrace from the recent down trend


Outlook Trade opportunity

Go long now at around 1.3620 - Have three levels of TP 1.365, 1.36670 and third is 1.37 with stops b.e


Risk Level - Low


Tips -

Always take note of any economical news event on our provided calender below


EURUSD 15min Bat harmonic pattern

EURUSD 15min Bat harmonic pattern


  • Took the trade, and by the time i post this on the blog it was up 12 pips
  • Took it because it was close to today's low, and hourly stoch was oversold

Took partial profit already

Cheers