USDCHF Forecast for the week 14th April, 2014
- New lows?
- Bullish Cypher ?
Weekly Chart
- Very Bearish Candle after market retest resistance level,
- With the heavy momentum it will not surprise us if we break below the lows of 2014 and find the major support level as shown on the chart
Daily Chart
- Daily candle is a doji which suggest a pause on the bearish run, and more often suggest a reversal
Hourly Chart
- Identified this cypher pattern which suggest a correction
- Last few hours Price action does show some strength of the bulls
- MACD - (not shown on chart) is starting to cross
Outlook Trade opportunity
Lightly counter trade this Bullish cypher
Risk Level Medium
Tips -
Always take note of any economical news event on our provided calender below
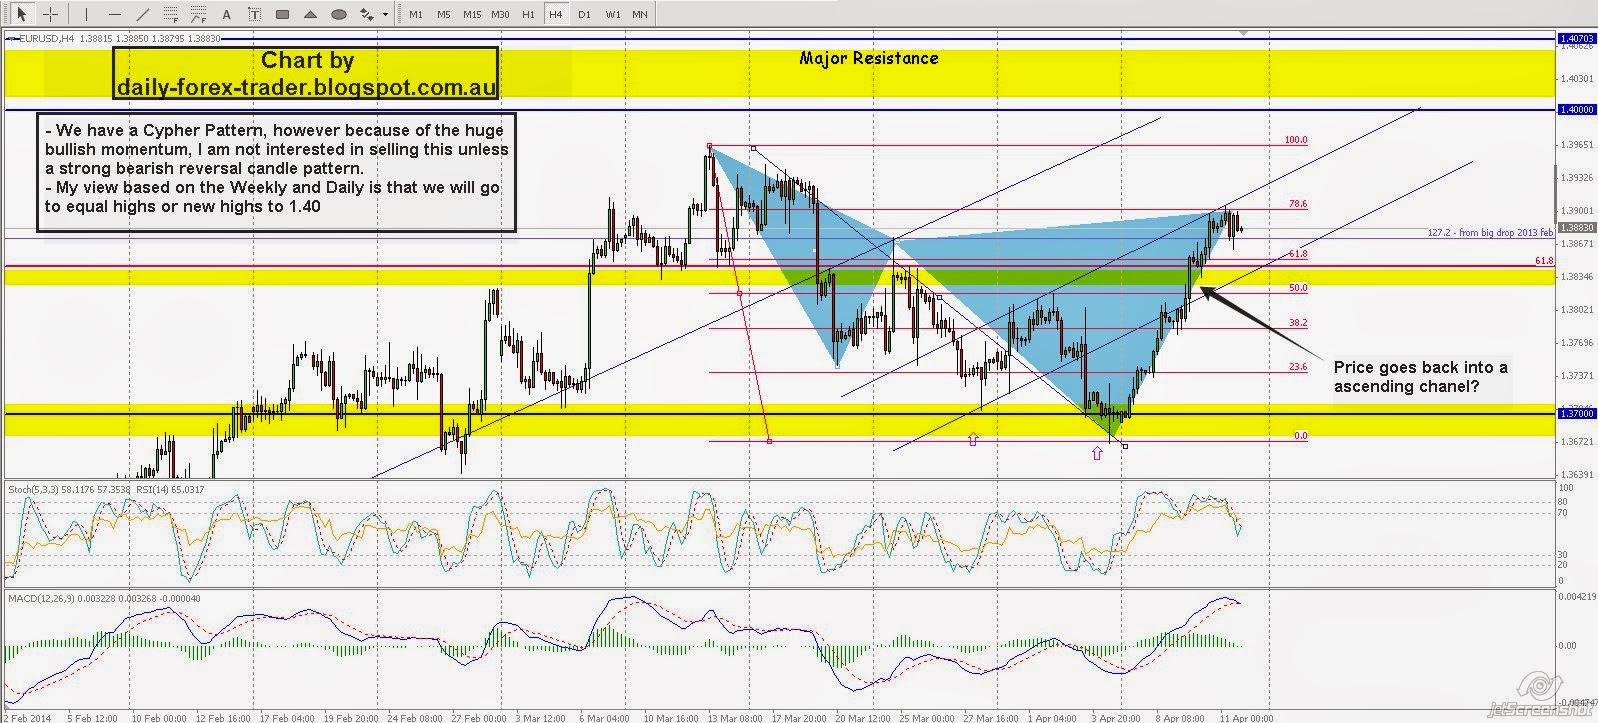
EURUSD Forecast for the week 14th April 2014
- Bearish Cypher? -
- 1.40 on the cards?
Weekly Chart
- Huge Bullish Week Candle reacting from the 1.37 level and have pushed prices well above the 1.38
Daily Chart
- Continuous 4 day rally brings us back above 1.38, and would be ideal to dig into a 4hr chart to see any hammer formation hammer to ride it potentially up to 1.40 or equal highs
- MACD is crossing at the bullish level, suggesting continue bullish bias. however Stochastic suggesting its overbought
- RSI is not overbought
Hourly Chart
- We could be travelling back in an ascending channel towards equal highs or the 1.40 zone level which on a daily and weekly provides very good resistance if we get there
- We have Bearish Cypher setup, however given the fact we are close to potential support it doesn't give us room for profit
Outlook Trade opportunity
- Looking forward, It would be ideal if prices retest the breakout level, and give us a bullish candle setup to ride this up. Noting perhaps early next week the US Dollar index might pick up and will lead a weaker euro.
- Remain Bullish sentiment going towards 1.40
Risk Level __
Tips -
Always take note of any economical news event on our provided calender below


