Tuesday, October 6, 2015

AUDUSD & EURAUD FORECAST AND TRADE SETUP FOR WEEK ENDING 9TH OCTOBER 2015

AUDUSD & EURAUD FORECAST AND TRADE SETUP FOR WEEK ENDING 9TH OCTOBER 2015


Hourly Chart

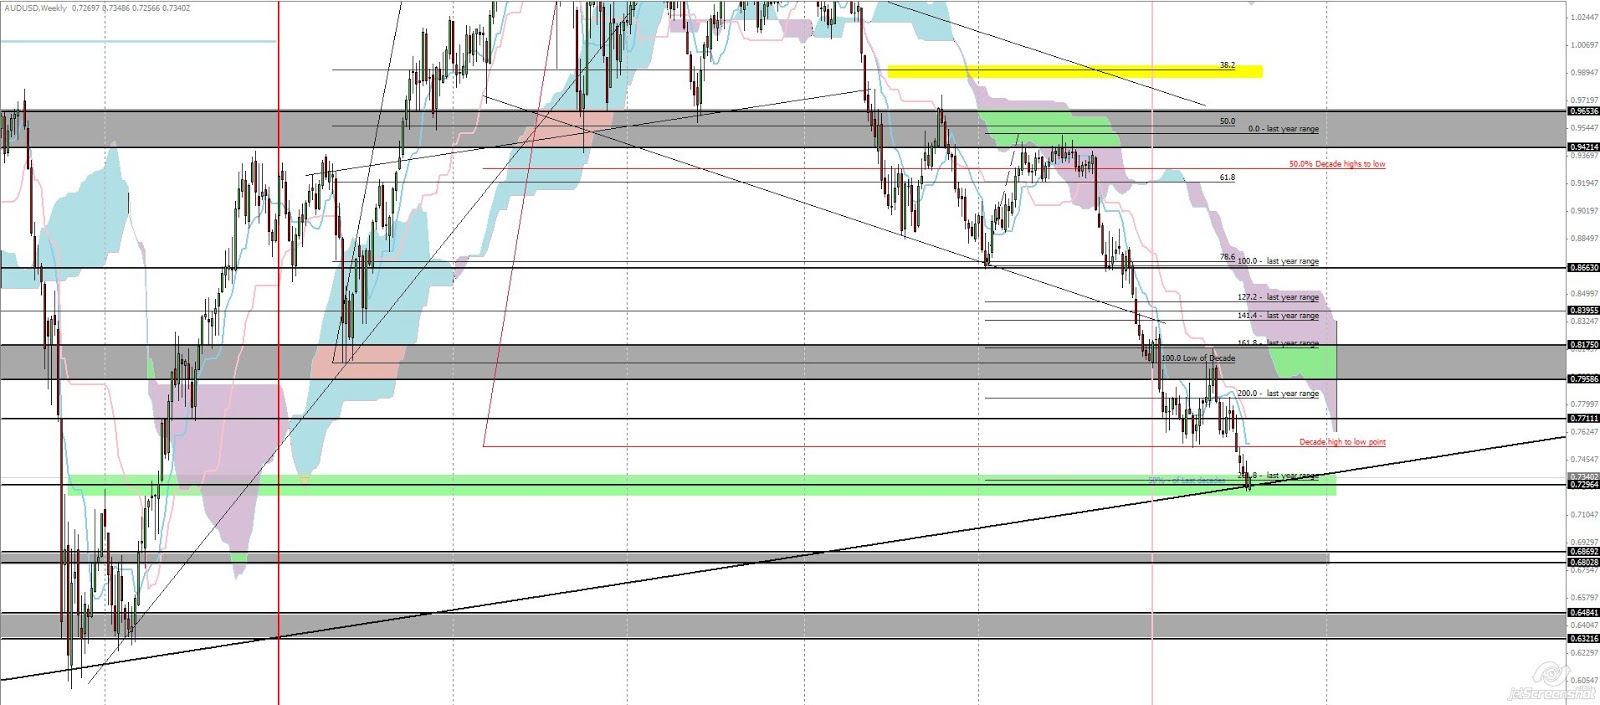
  • AUDUSD H1 chart with Ichimoku 1hr and 4 hr on the same chart - both indicating on a bullish trend
  • Bullish on both - targetting 0.7140 on a 1:2 risk to reward trade (64pips reward)
  • HOwever, once reached 0.7140-50 - potential Bearish trade will be on the lookout as there are few confluences
    • 2 x FIB Extention 
    • 1 Fib Retracement level
    • S/R zone
    • Will zoom into a 1hr / 15 min for short opportunity 


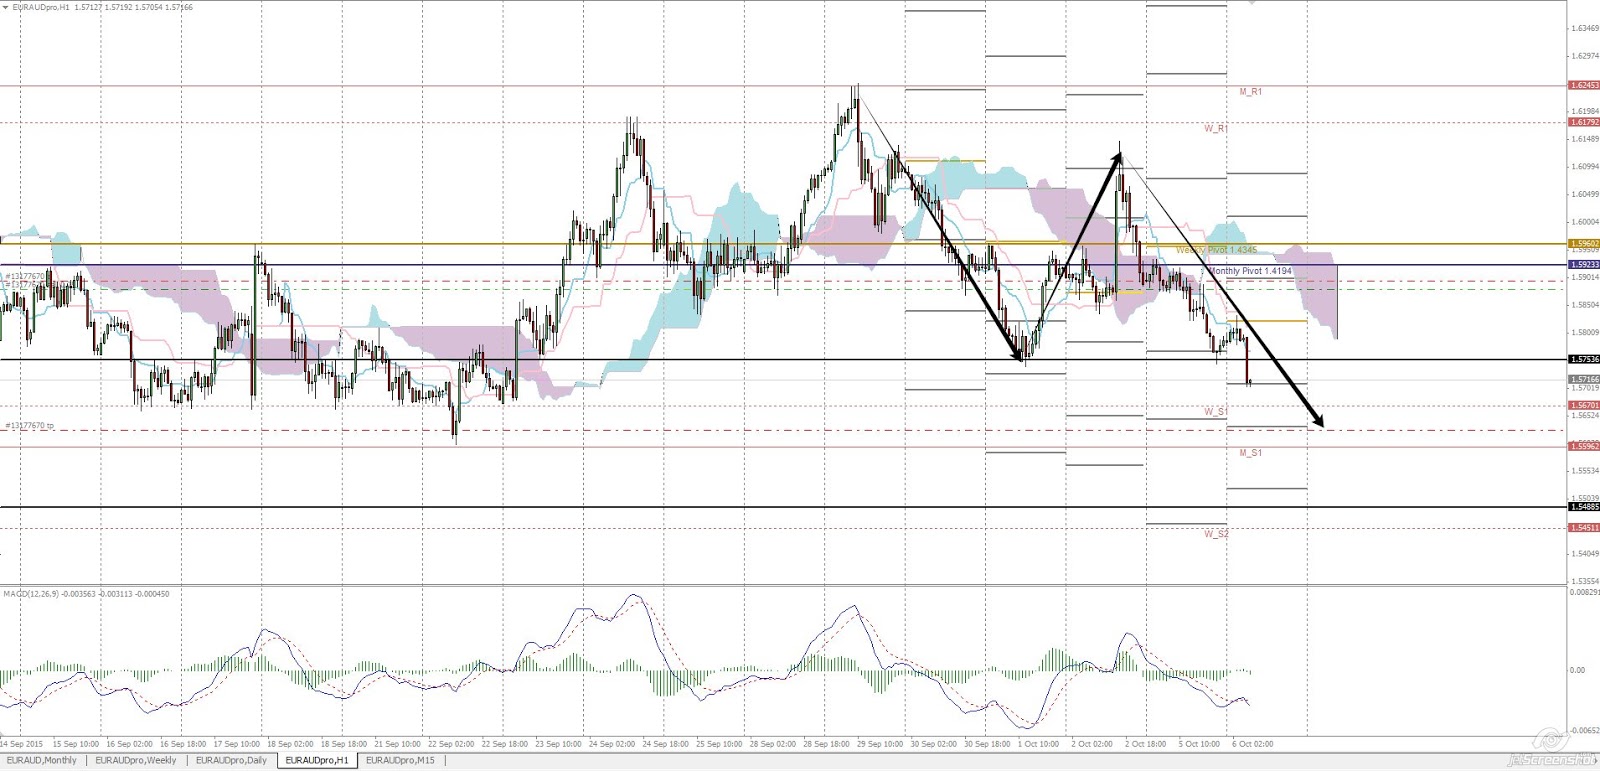
  • EURAUD H1 Chart - Bearish outlook / H4 Chart shown below - Bearish as well
  • Bearish view, targets 1.563 - on a 1:2 Risk to reward trade (250pips reward)


Outlook Trade opportunity

AUDUSD and EURAUD - please see above bullet points
these trades have already been taken yesterday (monday)

Risk Level - LOW


Tips -

Always take note of any economical news event on our provided calender below


Saturday, August 15, 2015

AUDUSD - Weekly Update - 17th - 21st August, 2015

AUDUSD - Weekly Update - 17th - 21st August, 2015

Weekly Chart


  • Bullish Candle formation although still closed below the highs of last week, however quite near the top
  • The week prior I was calling out for long opportunity, although I got stopped out from the sudden Yuan devalue, due to the rebound, I have resumed my bullish outlook for the short term


Outlook Trade opportunity

Still looking for long opportunity, a daily close above 0.74 will be required, and will target around the 0.75

Risk Level __


Tips -

Always take note of any economical news event on our provided calender below


Sunday, August 9, 2015

AUDUSD - Forecast and Trade Setup for August, 2015

AUDUSD - Forecast and Trade Setup for August, 2015


Weekly Chart

  • Last weeks candle shows bullish action from a significant level / support
    • Previous Support 
    • 50% Fib from last decades move
    • 261.8 fib ext of last years range
    • Ascending trendline (From monthly)


Daily Chart


  • Daily Candle from Tuesday managed to close above the Tekan- Sen

Hourly Chart


  • H4 - Broke through bearish Ichimoku Clouds
    • Forecast is bullish clouds

Outlook Trade opportunity

Near term momentum is on the bullish side - From my previous post, i have suggested to look for long opportunity at the strong support level. I will be targetting approx the 0.74800 as a partial take profit, and perhaps aiming for even the 0.75-759

For this week
I would suggest to wait for price action to break and stay above 0.743 and look for continuation

Risk Level Low


Tips -

Always take note of any economical news event on our provided calender below


Wednesday, July 29, 2015

AUDUSD Update - At major support - perhaps a trade idea? Last week of July 2015

AUDUSD Update - At major support - Last week of July 2015


Monthly Chart


  • This is a monthly candle with two more days to go
  • We have just hit major support
    • Look at previous price reaction at this level
    • Ascending Trendline drawn from the lows from 2000 and bounce from 2009, and possible bounce in 2015 ?

Weekly Chart


  • Just another closer look at the level we are at, (Support) - note weekly candle not closed

Outlook Trade opportunity

So what does this mean? - I have exited my shorts for the Aussie and now based on yesterday's price action on the H4, from an expected support level, I have entered long with stops at the low . Looking for at least 1:2 (Risk to reward)

- Will exit once hit my target at shy of 0.74, and will reenter accordingly if bullish bias is to continue.

Risk Level - Medium

Tips -

Always take note of any economical news event on our provided calender below


Sunday, June 28, 2015

AUDUSD - Weekly Forecast and Trade Setup for week ending 3rd of July, 2015

AUDUSD - Weekly Forecast and Trade Setup for week ending 3rd of July, 2015


Weekly Chart


  • The week ended negative, closing at the lows of the week prior. With the bearish momentum, I would not be suprised for continuation and breaking recent lows (this would be the fourth touch if so)
  • Ichimoku - Bearish

Daily Chart

  • Candles for the whole week has been closing below the kijun and tekan line, pointing to a weak aussie.
  • Friday's candle has given a hint of trend continuation to the downside
  • Ichimoku - Bearish

4 Hourly Chart


  • Very clear 4hr candle breaking the trendline and also support 
  • The yearly low / Support of 0.755 - My view will be easily broken due to earlier this year it had been tested three times, which means most buy orders had been filled - hence a very weak level.
  • Perhaps new lows in the coming week or two?

Outlook Trade opportunity

My short term trade idea from last week (of bullish), had failed. However for the longer term trade idea, this is working in favor so far.

Short term i am aiming for 0.7600 as i have opend a short trade last friday

Long term - target 0.70-0.72 (50% fib retrace of the decade)

Risk Level __


Tips -

Always take note of any economical news event on our provided calender below


Saturday, June 20, 2015

$AUDUSD - Weekly Forecast and Trade Setup - Week ending 26th of June, 2015


Hello readers!
Sorry I haven't been able to update my blog for two months now.  

Since Feb this year, I have decided to step into real estate, and had been busy since! The next 12 months is going to be a very exciting time for me as a realtor. This is something I've always wanted to do !

As much as I like real estate, my passion for trading never ends! - I haven't stopped trading! And i've had my best returns in the past 6 months.

I will be keeping my blog live and updated as often I can !
Happy trading and be good!

Regards,


Saturday 20th June, 2015


AUDUSD - Weekly Forecast and Trade Setup - Week ending 26th of June, 2015

Monthly Chart


  • Nothing major have happened after breaking major support in January.
  • RSI - is flurting around the 30' level
  • nb - june candle not complete 
  • Ichimoku - Bearish


Weekly Chart

  • Price did retrace / retest the breakout level and pushed prices all the way to the lows
  • Tekan and Kinjun lines are starting to narrow and is possible another attempt towards the 79-80 area is possible.
  • RSI is strenghtening 
  • Ichimoku - Bearish

Daily Chart


  • Although prices are still below the clouds, prices are now trading above the Tenkan Sen (blue line), If it continues to hold / acting as support, - this would be aisngs that a potential test towards the strong resistance at the 80c is coming


4 Hourly Chart


  • From the price action and break of the triangle? and second break of the ichimoku clouds - My bias would be towards the long side.
  • I would aim for 0.78700 area as the first target.

Outlook Trade opportunity

Based on the 4hr chart, I would have a short term trade (intraweek) to the longside with target to the .78700 as first target, and if this breaks and hold, would aim for 0.795-0.80

Long term view - still bearish. so if your a long term trader, I shall wait for this retrace to finish and enter a short towards the 0.70


Tips -

Always take note of any economical news event on our provided calender below


Saturday, March 28, 2015

$USDJPY Forecast and Trade setup for 30th March to 3rd April 2015

$USDJPY Forecast and Trade setup for 30th March to 3rd April 2015


Weekly Chart


  • Negative Divergence on RSI
  • Failed rally is what i can see because from the 61.8 fib

Daily Chart

  • Daily you could see a big drop in RSI momentum
  • Ichimoku is still on up trend, however could be easily broken as the cloud is weak
Hourly Chart

  • 4hr Ichimoku already have broken the up trend
  • Looks likely to test the 117.00 -116's

Outlook Trade opportunity

Personally I have a short trade from the ichimoku break and trendline break from the H4, and on top of that a weekly 61.8 fib

Risk Level __


Tips -

Always take note of any economical news event on our provided calender below


$XAUUSD $GOLD Forecast and Trade Setup for 30th March to 3rd April 2015

$XAUUSD $GOLD Forecast and Trade Setup for 30th March to 3rd April 2015


Weekly Chart


  • Weekly is quite heavy and ichimoku is down trend
  • RSI positive divergence
  • Possible double bottom for the mean time?

Daily Chart

  • Good price reaction from support
  • Ichimoku still in down trend
4 Hr Chart

  • Ichimoku is on up trend
  • Intraweek trades to the upside is ideal

Outlook Trade opportunity

Long for intraweek is ideal

Risk Level __


Tips -

Always take note of any economical news event on our provided calender below


AUDUSD Trade Setup and Forecast for 30th March to 3rd April, 2015

AUDUSD Trade Setup and Forecast for 30th March to 3rd April, 2015

Last analysis from the 16th of March, I have indicated that there was a false break, so going on a bias to the upside. This had played in my favour, but where to from now?

Weekly Chart


  • Last week candle looks like a shooting star formation
    • however the previous candle was a relatively bullish pattern which
  • RSI is above 30
  • On the weekly, seems heavy and obvious downtrend on the bigger picture

Daily Chart

  • After RSI positive divergence, we can see that the markets is on steps higher, however now that we are trading in the clouds and did have some rejection, we may retest the lows or a fib 61.8 before attempting a shot higher?
4 Hourly Chart


  • On the 4hr chart, ichimoku trend is up
  • As long as the lows don't break, or perhaps holding at the pivot, i still see another high coming


Outlook Trade opportunity

Personally, i believe we are on a shot to test the 0.80, I am still long

Risk Level __


Tips -

Always take note of any economical news event on our provided calender below


Sunday, March 15, 2015

$AUDUSD Trade setup and Forecast for the week 16th March, 2015

AUDUSD Trade setup and Forecast for the week 16th March, 2015


Comments from Last week Analysis:

Last week the aussie gave us new lows and broke support, this quickly regained back above broken support and had a daily close above. From my previous weeks trades This had stopped out on my long trade which was targetting 0.795.


Weekly Chart


  • Looks heavy, however, RSI is showing very slight divergence

Daily Chart


  • If you zoom into Thursday's candle, it has a huge bullish candle recovering previous two days losses
    • This also reacted to me as a false break and also holding by the Weekly S2
    • And also a 127.2 fib extension
  • RSI positive divergence


4 Hour Chart


  • I shall be taking a long if i see a break on the trendline / ichimoku clouds to the upside
    • Taking long opportunity because of the Thursday false break giving a big bullish candle

Outlook Trade opportunity

For bulls : - Take long either at the break of trendline or ichimoku to the upside

For Bears : If last weeks lows break and close below, happy to take short targetting 0.735 approx

Risk Level - Medium


Tips -

Always take note of any economical news event on our provided calender below


Sunday, March 1, 2015

AUDUSD Forecast and Trade Setup for the week 2nd to 6th March, 2015

AUDUSD Forecast and Trade Setup for the week 2nd to 6th March, 2015


Monthly Chart

  • February close was higher than the Jan Close, however only by slightly
  • Monthly Candle represents indecision
  • Ichimoku study is in a bearish trend

Weekly Chart

  • Weekly candle closed lower than the previous week, The body is relativly small
  • Ichimoku Study - trend is bearish, however Kijun-sen is flat meaning price could retrace up

Daily Chart


  • Ichimoku study - bearish trend however, Kijun and tekan sen line are very close to touching and perhaps cross

4 Hourly Chart


  • Ichimoku study - bullish trend

Outlook Trade opportunity

Bears - If this week's 4hr ichimoku cloud breaks, a possible continuation to the downside in the main trend is high probability

Bulls - If ichimoku holds, and the highs of last week is taken out, then my targets shall be 0.80

Personal note - looking at the Gold Chart, it seems bulls could take control this week, so the Aussie should be the same

Risk Level __


Tips -

Always take note of any economical news event on our provided calender below


Sunday, February 22, 2015

$AUDUSD - Forecast and Trade setup for the week 23 - 27 February 2015


Comments from Last week Analysis:

Last week's bullish analysis for the Aussie worked out quite well, and my mid week report  for a pullback long entry at the 38.2 fib / cloud retest was a perfect entry, and currently is in profit if your still on it, or if you want to manage your risk, you can put your break even stops for a risk free look for higher.  

Weekly Chart


  • Last weeks candle closed the week at the highs of the weeks range, and also the highest close for February.
    • This was followed from the previous two weekly candle's bullish candle pattern signal.
  • Ichimoku Study - Kijen-Sen is becoming flat, which usually attracts price towards it
    • However we are still in a very bearish trend trading well below the clouds


Daily Chart


  • From the five daily candles last week, there are two bullish candles, and both of the body of the candle is much larger in comparison to the 3 bearish (small body candle)
    • I am identifying this because looking at the price action momentum moves, and from that I can see a slightly stronger bulls right now.
  • I am still waiting for a larger thrust up to create the first significant move
  • Ichimoku Study - We are trading above the Tenkan Sen and below the Kijun-Sen, so you could expect some sideway action around the 0.775-0.792
    • Still below the clouds so still in a bearish trend on the daily

Hourly Chart


  • Possible Double bottom formation - note that i said Possible, because the neckline has not been broken yet, and until the neckline is broken, then i could identify it as a double bottom.
  • Ichimoku Study - We broke Ichimoku Clouds, so now in a bullish trend on the 4hr chart
    • After breaking clouds, price retraced back towards the clouds and has rebounded strongly., which we are currently sitting at resistance, and closed the week near the resistance.
    • Break of the resistance, should see 0.79-0.80

Outlook Trade opportunity

If we get a good break of resistance and price retrace back towards the breakout level, then a good place to go long and target 0.79-0.80 for the intraweek / intraday trade

For traders who don't want to go long on this pair, then wait for price to reach the 0.79-.80 for a rejection candle pattern, and go short.

Risk Level - Low


Tips -

Always take note of any economical news event on our provided calender below


Wednesday, February 18, 2015

$AUDUSD Midweek Update -Possible 3:1 Reward to Risk - 18th Feb, 2015

$AUDUSD Midweek Update -Possible 3:1 Reward to Risk - 18th Feb, 2015

Daily Chart


  • Tuesdays Piercing Line Daily Candle pattern - Bullish sign
  • Closing price was the highest for the current month
  • Ichimoku Kijun-sen is flat - which usually indicates that price should attract near or to that level

Hourly Chart


  • 4hr Ichimoku clouds broken - A sign that a change of trend to the upside.
  • Any pull back in the coming days if we are still in this range, the support should be found at the weekly pivot / 38.2 fib

Outlook Trade opportunity

For late comers or accumulation - Any pullback towards the 38.20 fib / Cloud retest / Weekly PIvot targetting 0.80-.81 area is possible giving around 3:1 risk reward.


Risk Level Low


Tips -

Always take note of any economical news event on our provided calender below


Saturday, February 14, 2015

$AUDUSD Trade Setup and Forecast for the week 16th February, 2015

$AUDUSD Trade Setup and Forecast for the week 16th February, 2015


Weekly Chart


  • So we have ended the week with a Doji Candle pattern which is an indecision candle and usually suggest a potential price reversal
  • Previous week we had a small spinning top candle at the support
  • Two reversal type candles here, and reversal looks more likely

Daily Chart

  • Two hammer candle formation at the support perhaps this is a double bottom.
  • RSI positive divergence

4 Hourly Chart

  • Ichimoku clouds was suggesting slight future bullish , and we are probably going to attempt to break the clouds early next week
  • There is two possible trades with this
    • long - targets towards 0.78-79, you could buy at the breakout and retest or you could open a long at the open
    • Short - if prices to rally to my price target, there is a Bat pattern formation which confluence a supply zone and resistance area.

Outlook Trade opportunity

Long - Targets 0.78-.79
Short - Short at around 0.79 with the Bat pattern

Risk Level - Low


Tips -

Always take note of any economical news event on our provided calender below


Sunday, February 8, 2015

$XAUUSD Gold Forecast and Trade setup for the week 9th February, 2015

XAUUSD Forecast and Trade setup for the week 9th February, 2015

Since my last trade setup from the 20th of Jan 2015, my short setup for the gold market was in my favor as it has worked out perfectly for a Cypher Harmonic Pattern which completed at a very nice 00 level and resistance level.

This week would be interesting after last Friday's positive US data pushing the gold even lower towards 1230's. Reflecting on the charts, the Weekly Candle and Friday's Daily Candle is quite bearish, and could perhaps have some momentum to go lower at beginning of the new trading week.
Lets see the charts and comments below:
Weekly Chart

  • Quite a large bearish candle last week
  • The Ichimoku Tekan and Kijun Sen lines should act as support
  • The Clouds did provide some resistance last two weeks where the candle did pierce through the clouds and having two consecutive relatively small body candle 

Daily Chart

  • Bearish Cypher did work perfectly from my post from 20th of Jan
  • Friday's Candle looks quite ugly for the bulls, where we currently holding support at the 1230's and last weeks Weekly S2 pivot
  • Ichimoku Clouds are still indicating a bullish future and if you see how price and the clouds had a huge gap / space... perhaps this retracement is needed
  • Apart from the clouds acting as support, we do have an ascending trendline drawn in from last years lows .
  • My view - still in a bullish bias, and possible sideway action to come

4 Hourly Chart


  • Now the 4hr Chart does look ugly. however we do have the 1230 support and the Ascending trendline and don't forget the Daily Chart Ichimoku clouds...
  • Note that I spotted some Positive RSI Divergence

Outlook Trade opportunity

For this week, there might be some sideway /ranging action if the 1230 support holds.

For Intraday / Scalps - Shorts favoured at around 1250

For Intraweek / longer term - Long Favoured - only if 1230 Support is holding or / false break is performed. If 1230 broken, then work with the 1200 level

Tips -

Always take note of any economical news event on our provided calender below


Thursday, February 5, 2015

AUDUSD Forecast and Trade Setup for 5th February 2015

AUDUSD Forecast and Trade Setup for 5th February 2015

- Reversal signal from weekly support level


Weekly Chart


  • Note that the weekly candle has not closed yet, however if it holds at these levels or higher it would be another strong indication for a reversal in the next few wks

Daily Chart


  • Tuesday's Daily close gave us a very nice hammer formation from the expected level and also from a Weekly Pivot S1


Hourly Chart


  • Zoom in the H1 / H4 charts, it has a classic reversal (Railway Tracks) from the support and weekly s1 pivot.
  • H1 Ichimoku has bullish future ahead,  
    • however thick Ichimoku clouds on the H4 timeframe should be noted 
    • Also on the H4 - note that the tekan and kijun has crossed into bullish direction
  • With the impulse leg , It is expected that it should reach next resis at 0.7868-.789 and then 0.795

Outlook Trade opportunity

Long targeting 0.7868 and 0.795
Also should take note of Gold Chart - If gold performs another low and rebound from 1240 and Aussie does not make a new low - it should give aussie bulls the advantage.

Risk Level Low / Medium


Tips -

Always take note of any economical news event on our provided calender below