AUDUSD Forecast and Trade Setup for the week ending 20th June, 2014
Weekly Chart

- Bullish Momentum is weakening with the Kijun-sen line confirming.
- It is also reacting from 38.2 fib level and minor resistance zone
Daily Chart

- From the Daily price action we can see that there is some resistance from the 38.2 fib level, and that we are attempting for the third time this year.
- If i calculate fib expansions from the swing from March to april, a FE61.8 is at the confluence level of 78.6 (Pink box on chart)
- That means It won't be suprising to see prices breach current resistance and test the 0.95 before a bigger retrace to low 90 levels
Hourly Chart

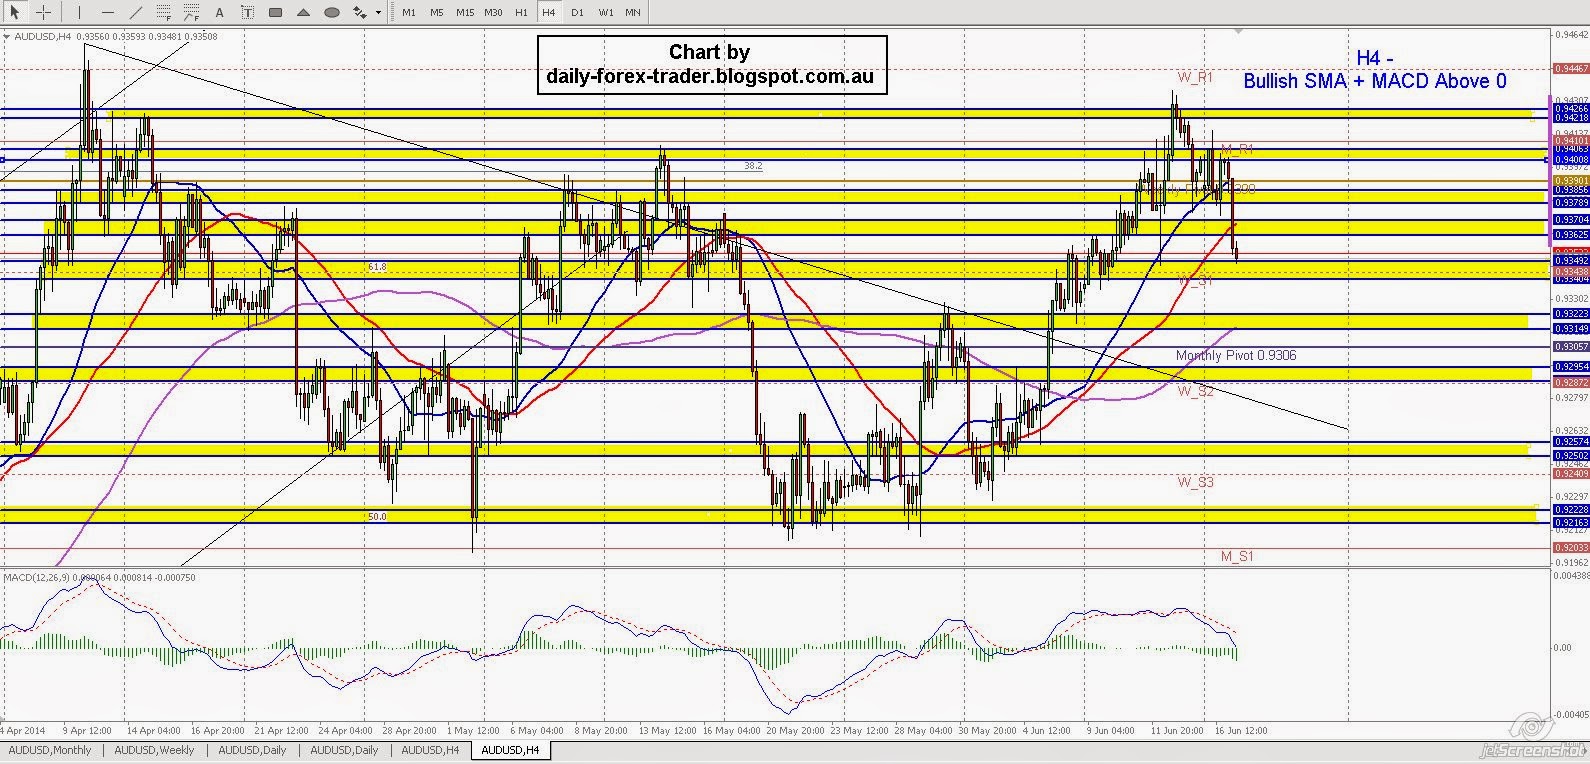
- Broke bearish trendline on the H4 chart
- Support could be found at the monthly pivot / 0.93 figure level / external of the broken bearish trendline
Below are two charts to identify the trend for Day trades / scalps (H1 and H4 Charts)
H1 - is Bearish
H4 - is Bullish

Outlook Trade opportunity
For Scalps to short till 0.93Intraweek / medium hold trades to wait for opportunity to go Long towards 0.95 perhaps