Wednesday, April 23, 2014

GBPAUD Forecast for the week 23rd April, 2014

GBPAUD Forecast for the week 23rd April, 2014


Weekly Chart


  • On the weekly, we are flirting around s/r / 1.80 level
  • Of the most recent bullish swing, we have held at the 50% retrace and would like price action to break back up above the 1.80 level for continuation up towards1.9-2.0


Daily Chart


  • We are trading in a descending Chanel , however with the fib expansions of the high to low swing , we have hit the FE100 level which also has a confluence of a ascending trend line
  • We have some strong resistance where we have a 38.2 and 50 overlapping fib at 1.830
    • below that we have the monthly pivot and the descending channel line

Hourly Chart


  • We need a clear break above 1.830 before any long position 


Outlook Trade opportunity

  • We need a clear break above 1.830 before any long position 

Risk Level Medium


Tips -

Always take note of any economical news event on our provided calender below


USDCAD Forecast for the week 23rd April, 2014

USDCAD Forecast for the week 23rd April, 2014


Weekly Chart

  • After the Hammer formation candle, as expected we saw last week have some bullish momentum

Daily Chart


  • We saw continued bullish momentum last week , however past few days we are seeing seeing doji's / indecision from price action
    • Having said that, yesterdays doji's body did actually close above minor resistance which should now become support however next resistance is near, so i expect some sort of rejection back towards the pink zone support before taking another leg up

Hourly Chart


  • Broke through resistance, and looking on towards testing the next resistance

Outlook Trade opportunity

Long preferred

Risk Level LOW


Tips -

Always take note of any economical news event on our provided calender below


Tuesday, April 22, 2014

USDJPY Forecast and Trade setup for the week 22nd April, 2014

USDJPY Forecast and Trade setup for the week 22nd April, 2014


Weekly Chart

  • We are still stuck in a tight range for nearly 3 months now, however getting close to the ascending trendline, which could provide some support for some action
  • My bias still Bullish

Daily Chart


  • We had a continous bullish days last week, where we have broken slightly resistance,
    • Today's candle is showing some bearish price action, but this could be a retest of the breakout zone / retest support before continuation to the upside
  • Note there is the ichimoku clouds which could give some resistance
  • Bias is bullish since we have broken the descending trendline, and had retested the bottom and rejected also from an long term ascending trendline.

Hourly Chart


  • Although we have broken resistance, and trading majority in the s/r zone, I believe what is stopping the bullish momentum is the Monthly pivot, and confluence of the 50% fib and the clouds.
    • Having the strong resistance, it could be possible for price to pull back and reload again to the upside to break it.

Outlook Trade opportunity

If price pull back, could look at Price action candle bullish pattern at good fib levels / kumo clouds

Risk Level Med


Tips -

Always take note of any economical news event on our provided calender below


AUDUSD Forecast and Trade Setup for the week 22th April, 2014

AUDUSD Forecast and Trade Setup for the week 22th April, 2014

  • Bearish Trend continuation? (Correction over?)


Weekly Chart


  • As anticipated on the previous weekly forecast, we have continued to reject from the Clouds/ Fib level 38.20
  • Last weeks candle wiped off just over half of the previous bullish candle

Daily Chart


  • Last week we had a two huge bearish days, however yesterday (Monday) we have a slightly bullish doji?
  • Stochastic is also in oversold and turning and perhaps we might retrace and retest the resistance

Hourly Chart


  • Above I have two charts, one with the Ichimoku and one without
  • We broke slighly below the Ichimoku Clouds, and now trading in the clouds where i will look for hourly / 4hrly shooting star formation from the zone.


Hourly Chart

  • There is a potential Cypher pattern if price goes up to 78.5% fib which is a good confluence of weekly R1 pivot and Resistance yellow zone on my chart.
    • There is also other ways to look at it if you draw two sets of fibs and there good confluence levels to look for short opportunity.

Outlook Trade opportunity

As above in Hourly chart / or perhaps a potential Cypher

Risk Level LOW


Tips -

Always take note of any economical news event on our provided calender below


USDCHF Forecast for the week 22nd April, 2014

USDCHF Forecast for the week 22nd April, 2014

  • Bullish Cypher still in play

Weekly Chart

  • Last weeks price action was bullish and we recovered nearly half of the sell off of the previous wk prior

Daily Chart

  • We had continuous bullish price action daily candles
  • Broke through resistance, however nearing another minor resistance
  • We are also trading in the ichimoku clouds and Stochastic is trading in a overbought zone
Hourly Chart

  • As you could see the bullish cypher identified over a week ago did play out quite well
  • This is a 4 Hourly chart, where we have broken through the Ichimoku clouds, however we are in an area of potential resistance (yellow zone) and market could retrace to the downside to test the support zone in the following days.
  • We are also travelling on the upper line of the ascending channel., 

Outlook Trade opportunity

We could take a short if a convincing hourly / 4hr shooting star candle is rejected from the yellow zone.

If market does test the support, we could wait for a bullish hammer formation to continue the up trend

Risk Level Low


Tips -

Always take note of any economical news event on our provided calender below


Wednesday, April 16, 2014

GOLD XAUUSD - LONG TERM VIEW

GOLD XAUUSD - LONG TERM VIEW


Daily Chart


  • Do you see any similarity?

Outlook Trade opportunity

Short towards sub 1000!

Risk Level __


Tips -

Always take note of any economical news event on our provided calender below


Nikkei Forecast for the week 14th April, 2014

Nikkei Forecast for the week 14th April, 2014

- on to new highs perhaps?


Daily Chart


  • Technically It tells me that we have bottomed for the year, and is on the way up to new highs 17000-18000
  • This also means there is long opportunity for the yen fx crosses

Outlook Trade opportunity

Long at pull back

Risk Level Low


Tips -

Always take note of any economical news event on our provided calender below


Tuesday, April 15, 2014

USDCAD Forecast for the week 14th April, 2014

USDCAD Forecast for the week 14th April, 2014

Weekly Chart


  • Hammer Candle Formation last week from the Support Zone With the long wick , this shows buyers are really in control.

Daily Chart


  • False break of support is noted from last weeks price action.  However Ichimoku Studies shows that we have broken the clouds and trading below, which suggest in a bearish mode. Having said that, the current clouds has some room for any bullish momentum to take place.  
    • We also have the Tekan San line which is flat , which usually attracts price towards the line.

Hourly Chart


  • This is the only Time Frame Chart (H4) which we are trading into the clouds acting as possible resistance, So I would like to see price go above the the clouds and break the 23.6% fib level to consider long trade

Outlook Trade opportunity

Please see H4

Risk Level LOW


Tips -

Always take note of any economical news event on our provided calender below


USDJPY Forecast for the week 14th of April 2014

USDJPY Forecast for the week 14th of April 2014


Weekly Chart


  • We have been trading between the 101-103 region for nearly two months now
  • Approaching the ascending trendline


Daily Chart


  • 101 level has been tested 4 times and if prices do test for the fifth time, I would be more bias for price to breach this level down to sub 100 level
  • 102.50 would be a level to look out for sellers to push the market back down
  • Ichimoku study seems to be in a bearish mode as the two lines are crossed also trading beneath the clouds


Hourly Chart

  • Ichimoku lines are squeezed and possibly indicating some bullish action if prices move up further, however upside could be limited from clouds trendlines and fib levels from last weeks sell off.

Outlook Trade opportunity

No trades identified

Risk Level __


Tips -

Always take note of any economical news event on our provided calender below


Monday, April 14, 2014

AUDUSD Possible Gartley setup scalp / and swing trade setup - Monday 14th April, 2014

AUDUSD Possible Gartley setup scalp / and swing trade setup - Monday 14th April, 2014


Hourly Chart


Outlook Trade opportunity

Short at 78.6% fibor wait for price action candle for reversal setup for a low risk trade


Risk Level LOW


Tips -

Always take note of any economical news event on our provided calender below


AUDUSD Forecast for the week 14th April 2014

AUDUSD Forecast for the week 14th April 2014

  • Bears stepping in?

Weekly Chart


  • Weekly Ichimoku Clouds are near, and we have briefly spiked into the clouds acting as resistance
  • Confluence level of Fib 38.20
  • Also a Support and Resistance level

Daily Chart


  • On a Daily, it shows a stronger resistance level (0.94) with Monthly Pivot R1 at the same level
  • A Shooting Star Candle formation is also noted 
    • With the upper trend line of the ascending channel acting as resistance
  • Stochastic is giving us a beautiful negative divergence
  • Overall, Daily technical is giving us a perfect setup to go short


Hourly Chart


I Have the H4 and H1 chart shown

  • H4 - We are trading above clouds, however H1 - we have broken the clouds
  • H1 chart have drawn a descending and ascending trendline which forms a squeeze / triangle, 
  • Oscillators we are not seeing anything significant to note


Outlook Trade opportunity

Short

Risk Level Low to Medium


Tips -

Always take note of any economical news event on our provided calender below


Saturday, April 12, 2014

USDCHF Forecast for the week 14th April, 2014

USDCHF Forecast for the week 14th April, 2014

  • New lows?
  • Bullish Cypher ?
Weekly Chart

  • Very Bearish Candle after market retest resistance level, 
  • With the heavy momentum it will not surprise us if we break below the lows of 2014 and find the major support level as shown on the chart


Daily Chart


  • Daily candle is a doji which suggest a pause on the bearish run, and more often suggest a reversal

Hourly Chart

  • Identified this cypher pattern which suggest a correction
  • Last few hours Price action does show some strength of the bulls
  • MACD - (not shown on chart) is starting to cross

Outlook Trade opportunity

Lightly counter trade this Bullish cypher

Risk Level Medium


Tips -

Always take note of any economical news event on our provided calender below


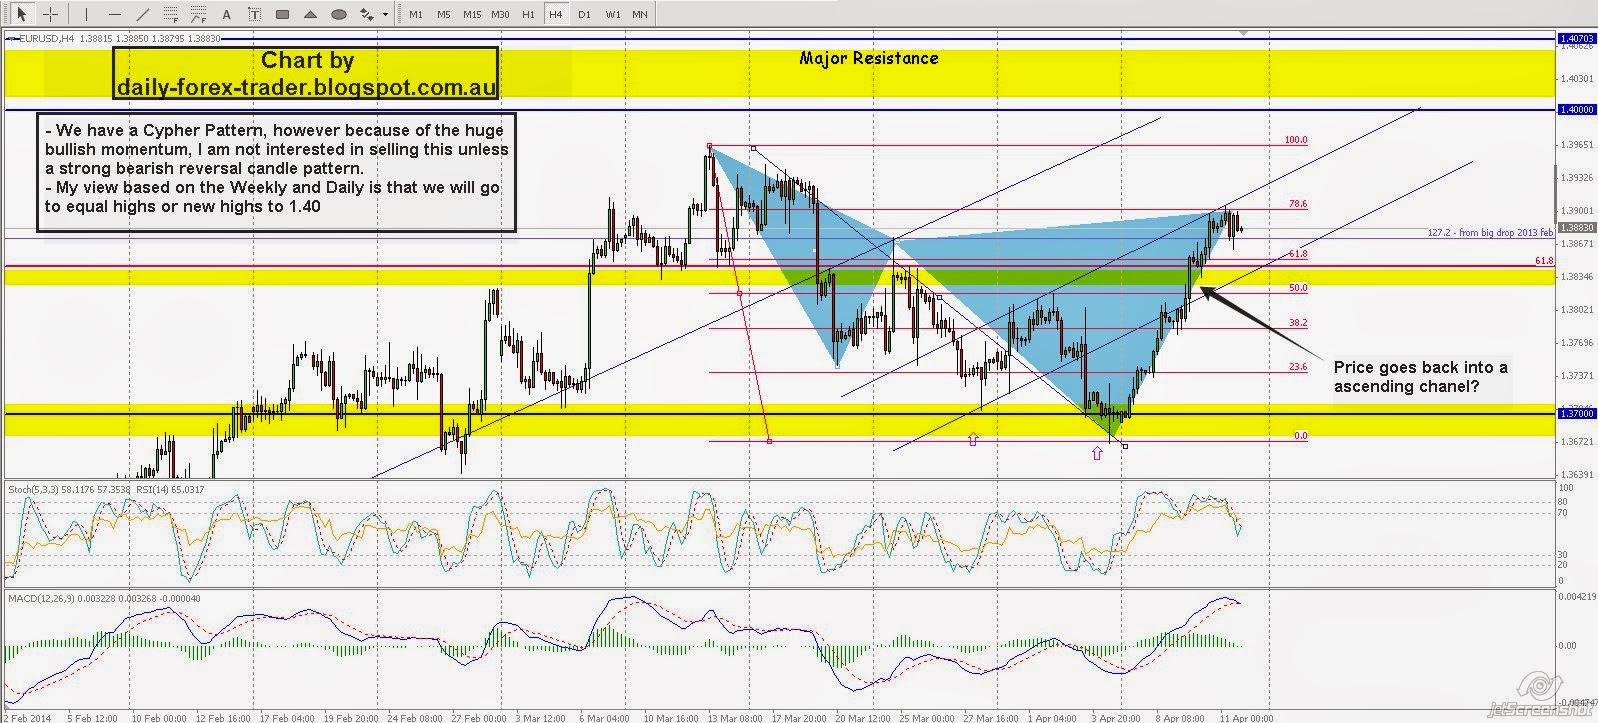
EURUSD Forecast for the week 14th April 2014

EURUSD Forecast for the week 14th April 2014

  • Bearish Cypher? -
  • 1.40 on the cards?
Weekly Chart


  • Huge Bullish Week Candle reacting from the 1.37 level and have pushed prices well above the 1.38

Daily Chart

  • Continuous 4 day rally brings us back above 1.38, and would be ideal to dig into a 4hr chart to see any hammer formation hammer to ride it potentially up to 1.40 or equal highs
  • MACD is crossing at the bullish level, suggesting continue bullish bias. however Stochastic suggesting its overbought
  • RSI is not overbought

Hourly Chart

  • We could be travelling back in an ascending channel towards equal highs or the 1.40 zone level which on a daily and weekly provides very good resistance if we get there
  • We have  Bearish Cypher setup, however given the fact we are close to potential support it doesn't give us room for profit 

Outlook Trade opportunity

  • Looking forward, It would be ideal if prices retest the breakout level, and give us a bullish candle setup to ride this up. Noting perhaps early next week the US Dollar index might pick up and will lead a weaker euro.
  • Remain Bullish sentiment going towards 1.40

Risk Level __


Tips -

Always take note of any economical news event on our provided calender below


Friday, April 11, 2014

USDCHF Forecast and Potential Cypher Trade Setup 11th April 2014

USDCHF Forecast and Potential Cypher Trade Setup 11th April 2014


Daily Chart


  • On a Daily Chart we could see a huge fall continuous for 4 days
    • Fall from ascending channel 
  • Looks bearish and some may argue we could find lows as we continue the bearish tone. However I have spotted this cypher pattern which could work nicely due to the fact these patterns if formed at top and bottoms work much better

Hourly Chart


  • We have a potential Cypher Pattern
  • Stochastics is extremely oversold but remains in the oversold (slight divergence) - this doesn't mean anything but still in a bearish mode
  • RSI - slight divergence where its starting to head up above 30

Outlook Trade opportunity

I would place Long trade now with stops below the X

Risk Level Medium


Tips -

Always take note of any economical news event on our provided calender below


Wednesday, April 9, 2014

AUDJPY Possible Trade Setup (Short) - 09.04.14

AUDJPY Possible Trade Setup (Short) - 09.04.14


Hourly Chart


  • Confluence of two fibs 38.2 and 61.8
  • 50 and 100ma pointing down + 200ma is flat and crossing the 50ma
  • Shooting Star Candle


Outlook Trade opportunity

Short

Risk Level Medium


Tips -

Always take note of any economical news event on our provided calender below


Tuesday, April 8, 2014

USDJPY Forecast and Setup for the week 8th April 2014

USDJPY Forecast and Setup for the week 8th April 2014

Weekly Chart


  • Last week Candle was a Shooting Star Pattern 
    • Cautious here because the Body of the candle is above previous body, which has a lower chance of a reversal candle


Daily Chart


  • We have had  Bearish run since Friday, however we are nearing support at around 102.700 which has 
    • Fib 50, 38.2 
    • Previous Resistance which now should hold as support
    • Outside return of an Descending Trendline which could be a retest of the break
    • Ichimoku Cloud and Kijun san line 
  • We also have a hidden stochastic positive divergence (possible)


Hourly Chart


  • Early Asian Session we continue to see sell off, however bound a good bounce from the monthly pivot / W S1 Pivot which also is a previous resistance, which becomes support
    • I would like a smaller push down towards 102.500-600 before attempting a long scalp
  • Stochastics on the H4 is at oversold still

Outlook Trade opportunity

If there is a lower push down, would look for PA bounce to go for a long.
Going for a long now is risky with the big bearish Candle (on the H1)
Note we have JPY data today

Risk Level - Medium


Tips -

Always take note of any economical news event on our provided calender below


AUDUSD Forecast for the week 8th April 2014 - Has Cypher been activated yet?

AUDUSD Forecast for the week 8th April 2014 - Has Cypher been activated yet?


  • The reversal zone has been touched slightly last week
  • Bullish momentum is strong

Monthly Chart


  • Obvious Stochastic Positive divergence
  • Near Resistance

Weekly Chart


  • Stochastics is overbought territory but still rising
  • RSI is also pointing upwards
  • Last week Candle is a small bullish hammer closing higher than its previous huge bullish candle
    • However candle body is small

Daily Chart

  • Bearish Cypher zone has been touched slightly last week, however prices managed to creep back up
  • There is a possible divergence, but would like to see a higher high perhaps to the 0.935

Hourly Chart


  • Technically Chart is showing that bulls are in control and pushing prices to the high 0.92, and if we manage to trade there, a high chance we will break to the upside to test its 0.935 which in terms of Fibonacci it has very strong level and confluence
  • Flip side, if we get a fail rally (currently Tuesday Asian Session), Looking to see a break of the ascending trendline to go short (for scalp / intraday trades)

Outlook Trade opportunity

I would like to see price shoot up towards 0.935 and drill to an hourly to look for a shooting star candle pattern and take a short, otherwise if prices to fail to go above 0.93, would look for break of ascending trendline to go short

Risk Level LOW


Tips -

Always take note of any economical news event on our provided calender below