Monday, July 14, 2014

AUDUSD Daily Outlook for the week ending 18th July , 2014

AUDUSD Daily Outlook for the week ending 18th July , 2014


Weekly Chart

  • Negative stochastics Divergence still in play as noted last week's analysis
  • Last weeks candle was an inside bar


Daily Chart


  • Recent Support is still holding quite well (0.93350) after the strong selling from two wks ago. Last week we did try to revisit the highs but a confluence of 61.8 and resistance zone has provided resistance to push down to sub .940
  • For this week, i shall look for market to retest the 0.94250-945 for a negative candle to evolve before taking a short.
  • Note - The Ichimoku clouds are thin which is a sign where the market could easily break the clouds and start changing the trend

Trend Filter
Daily
H4
H1
3 MA Cross
Bullish
RANGE
Range / No trend -
30SMA
Above however 30ma is slightly pointing down
Above
Above
50SMA
Above
Above
Above
100SMA
Above
Below
Above
Ichimoku
Bullish
Bearish
Bearish
SCORE
4/5 Bearish
2/5 Bearish
1/5 Bearish

Outlook Trade opportunity

Please see daily

Risk Level __


Tips -

Always take note of any economical news event on our provided calender below


Monday, July 7, 2014

AUDUSD Forecast and Trade Setup Levels to watch - Monday 7th July , 2014

AUDUSD Forecast and Trade Setup Levels to watch - Monday 7th July , 2014

Weekly Chart

  • Note that we have negative divergence on stochastics

Daily Chart


  • We have had two huge negative days and with Thursday wiping off the gains from last week
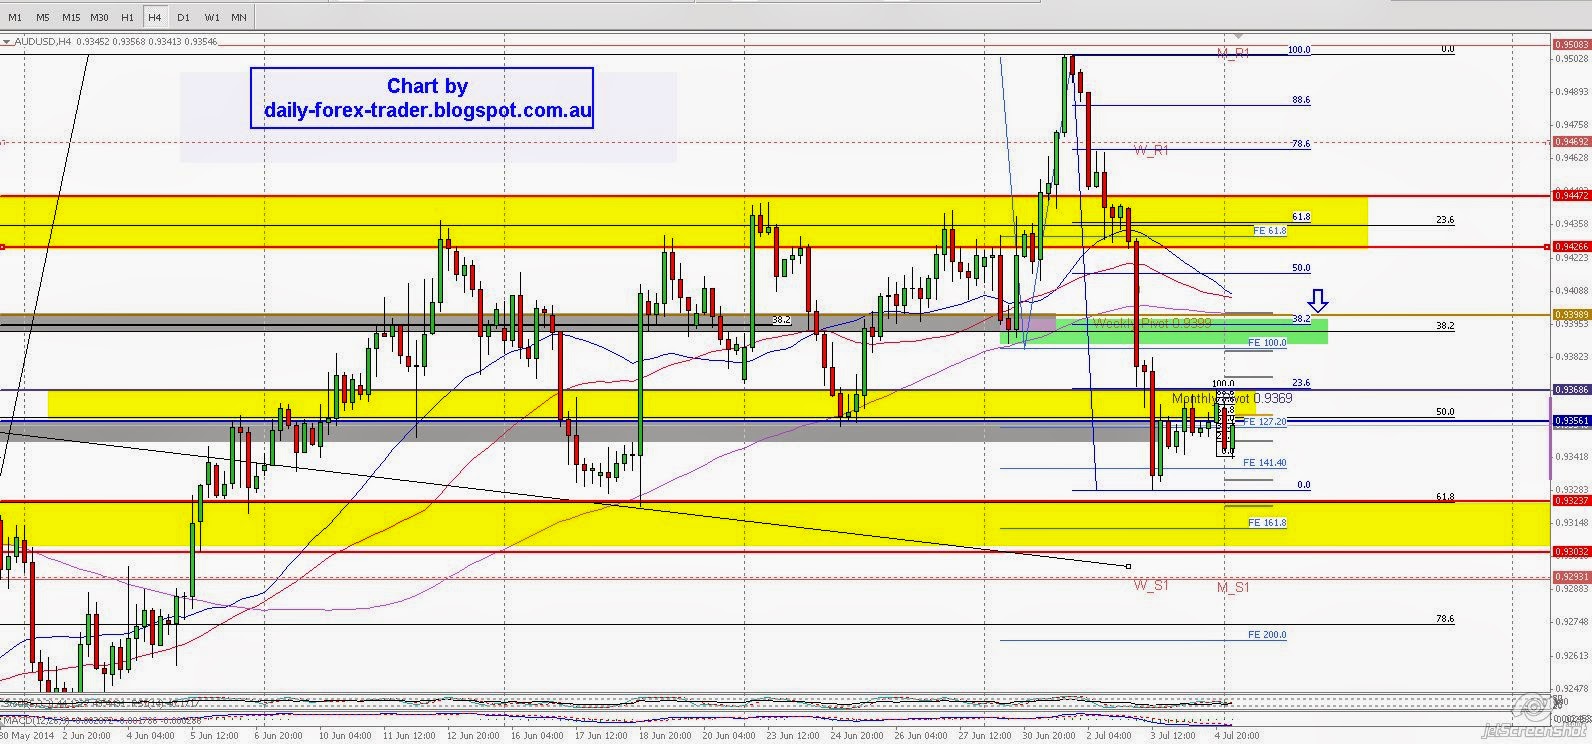
  • I have noted the two scenarios - If support holds i believe a retrace to test the 0.94's is possible before further selling pressure
  • If we break the support with ease, i'll look for pull back of broken support to ride it down to next support level

Hourly Chart


  • We may start the week trying to retrace some of the losses last week, therefore i have noted the Resistance zone for possible short orders in green (which is also the pivot and 38.2 fib

Trend Filter Table

Trend Filter
Daily
H4
H1
3 MA Cross
Bullish (however 30 and 50 is close)
Bearish (have not crossed but pointing south)
Bearish
30SMA
Below
Below
Above
50SMA
Holding
Below
Below
100SMA
Above
Below
Below
Ichimoku
Bullish
Bearish
Bearish
SCORE
1/5 Bearish
5/5 Bearish
4/5 Bearish
*This table is to help you determine your direction of trades based on different Time Frames.

Outlook Trade opportunity

Market could try to retrace to target 0.9390, and there we would look for selling signals from price action

Risk Level LOW


Tips -

Always take note of any economical news event on our provided calender below